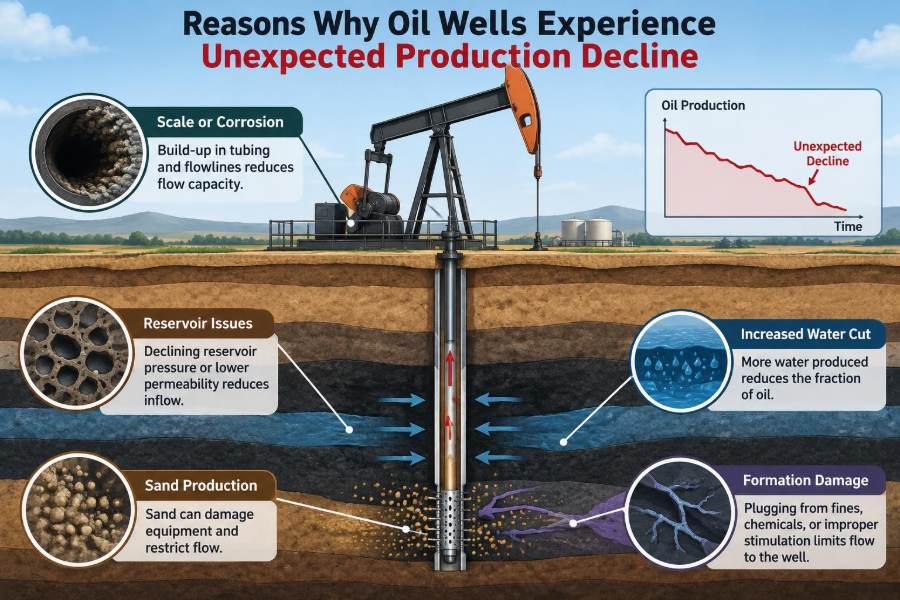

A well can appear healthy on the morning report, meeting its target with stable pressures and manageable water production. Then, over a few days or weeks, the oil rate falls sharply. The immediate question is often simple: has the reservoir run out of energy?
Sometimes that is the answer. More often, an unexpected decline is the visible result of a specific restriction, equipment problem, fluid change, or operational event. The reservoir may still contain mobile oil, but the well has lost some ability to deliver it to surface.
That distinction matters. Treating every decline as natural depletion can leave recoverable production behind. Reacting too quickly with an intervention can also damage the well, spend capital inefficiently, or mask the real cause.
Production decline is therefore a diagnosis problem before it becomes a treatment problem. A disciplined comparison of rate, pressure, water cut, gas-oil ratio, operating conditions, and recent field activity usually narrows the possibilities quickly.
🧭 What Makes a Decline “Unexpected”?
All producing wells decline eventually. Reservoir pressure falls, fluid contacts move, and the easiest-to-produce oil is commonly recovered first. A natural decline is gradual behavior broadly consistent with the field’s reservoir model and the well’s previous trend.
An unexpected decline is faster than anticipated, begins suddenly, or occurs without a matching explanation in reservoir conditions. A step change after a shutdown, chemical treatment, pump adjustment, or nearby well activity deserves investigation.
📉 Separate Rate Loss From Measurement Error
Before diagnosing the subsurface, confirm that the reported production is real. Allocation errors, an inaccurate test separator, faulty multiphase metering, tank gauging issues, or a changed test duration can create an apparent decline.
Compare daily allocated volumes with well-test results, liquid levels, run time, and sales or tank data. A well that appears to have lost oil but shows unchanged total liquid and inconsistent test results may have a measurement or allocation problem rather than a reservoir problem.
🗂️ Start With the Well’s Recent Timeline
A timeline is one of the most useful diagnostic tools. Record shut-ins, workovers, acid jobs, scale treatments, choke changes, artificial-lift adjustments, power failures, chemical changes, and nearby drilling or injection activity.
Timing does not prove causation, but it directs attention. For example, a sharp loss immediately after a prolonged shut-in may point toward wax deposition, scale precipitation, liquid loading, or difficulty restarting artificial lift.
🪨 Reservoir Pressure Depletion
As fluids are produced, pressure in the drainage area declines unless it is supported by water influx, gas injection, water injection, or another mechanism. Lower pressure reduces the force available to move oil through the reservoir and into the wellbore.
The effect is often gradual, but it can become more visible when pressure approaches the oil’s bubble-point pressure or when a well reaches the limit of its artificial-lift capacity. Pressure surveys and production history help distinguish ordinary depletion from a localized well problem.
🧱 Reduced Reservoir Deliverability
A reservoir can hold substantial oil while delivering it slowly. Deliverability describes how readily fluids flow from the formation to the wellbore at a given pressure drawdown.
Low permeability, thin productive layers, compartmentalization, and limited connected rock volume can all restrict deliverability. A well may initially produce strongly from near-wellbore fluids, then decline once that local volume is depleted faster than the surrounding reservoir can replenish it.
🧪 Formation Damage Near the Wellbore
Formation damage is a reduction in permeability close to the well, where even a thin impaired zone can cause a large pressure loss. It is commonly expressed as increased skin, a term for additional resistance to flow near the wellbore.
Potential causes include incompatible completion fluids, drilling-fluid filtrate, fines migration, clay swelling, emulsions, solids invasion, or improperly selected treatment chemicals. The reservoir rock farther away may remain productive, but the well must overcome an added bottleneck.
🫧 Fines Migration and Clay Sensitivity
Fine particles can detach from pore walls when salinity, pH, flow velocity, or stress conditions change. Once mobilized, these particles may bridge narrow pore throats and reduce permeability near the well.
Clay-bearing formations can be especially sensitive to incompatible water. This is why water chemistry matters during completion, stimulation, and water shutoff work: a treatment intended to improve a well can create damage if it is not compatible with formation minerals and brine.
⚗️ Scale Deposition in the Completion
Scale forms when dissolved minerals precipitate as pressure, temperature, or fluid chemistry changes. Common deposits can form in perforations, tubing, pumps, valves, and flowlines, progressively reducing the flow area.
A scaling problem may show up as falling rate with rising pressure upstream of a restriction, declining pump performance, or recurring failures in a known scale-prone interval. Samples, water analysis, and inspection during intervention are more reliable than assuming every hard deposit is the same mineral.
🕯️ Wax and Paraffin Buildup
Wax can precipitate from some crude oils when temperature falls below the wax appearance temperature. It may accumulate on tubing walls, in flowlines, around restrictions, or at colder surface equipment.
The problem is often operationally visible after reduced flow, a cold period, or a shutdown that allowed fluids to cool. Mechanical scraping, thermal methods, solvents, and chemical inhibitors can help, but the appropriate approach depends on crude behavior, deposit location, and facility constraints.
🧫 Asphaltene Deposition
Asphaltenes are heavy crude components that can become unstable when pressure changes, gas is liberated, or incompatible fluids are introduced. They may deposit in the formation, perforations, tubing, or surface equipment.
Unlike wax, asphaltene deposition is not simply a low-temperature problem. Confirming it often requires fluid characterization and deposit analysis, because an incorrect chemical treatment may do little or worsen an emulsion or solids issue.
🌬️ Gas Liberation Below Bubble Point
When reservoir pressure falls below bubble point, gas comes out of solution in the oil. Some liberated gas can provide drive energy, but gas near the wellbore can also reduce the effective permeability available to oil.
High gas saturation may cause gas to flow preferentially while oil mobility falls. This can produce a rising gas-oil ratio alongside a declining oil rate, although the pattern must be interpreted with pressure data and artificial-lift behavior rather than as a standalone diagnosis.
💧 Water Breakthrough and Rising Water Cut
Water can reach a well from an aquifer, injected-water front, fracture, high-permeability streak, or channel behind casing. As water saturation rises in the producing rock, the relative permeability to oil can decline.
A higher water cut does not always mean the oil rate must collapse immediately, but it increases lifting and disposal demands. If total liquid capacity is fixed, additional water can displace oil volume at surface even when the reservoir still supplies both fluids.
🧩 Coning and Cusping Around the Well
Water coning occurs when strong drawdown pulls water upward toward a well from an underlying water zone. Gas coning is the equivalent downward movement of gas from an overlying gas cap. In layered settings, the shape may be a cusp rather than a symmetrical cone.
Excessive drawdown can accelerate these processes. Reducing rate, changing completion intervals, isolating a contributing zone, or redistributing inflow may help, but each option sacrifices something: production rate, intervention cost, or certainty of outcome.
🕳️ Casing Leaks and Behind-Casing Flow
A leak in casing, tubing, packers, cement, or completion seals can allow fluids to bypass intended flow paths. Water or gas may enter the well from an unwanted zone, while oil from the target interval is partially bypassed or choked by the changed pressure distribution.
Temperature logs, noise logs, pressure tests, production logs, and mechanical integrity tests may be used depending on the completion. These failures require careful diagnosis because the repair method must match the actual leak path.
🔫 Perforation Plugging and Limited Entry
Perforations connect the wellbore to the formation, but they can become restricted by scale, fines, debris, crushed-zone damage, corrosion products, or deposits. A few blocked perforations can matter greatly in a thin interval or a completion designed for limited entry.
Production logging can reveal whether only part of the intended interval is contributing. A stimulation or cleanout may restore inflow, but it should be designed around the damage mechanism rather than performed as a generic response.
🛠️ Artificial-Lift Underperformance
Many wells do not flow naturally at economic rates and depend on rod pumps, electric submersible pumps, gas lift, progressive cavity pumps, or hydraulic systems. A decline in produced fluid can be caused by lift failure even when reservoir inflow is unchanged.
Typical indicators include changed motor load, pump fillage issues, erratic fluid level, unstable casing pressure, gas interference, worn valves, tubing leaks, or reduced gas-lift injection. Treat the well as a complete system: reservoir inflow and lift performance must be evaluated together.
🔌 Electric Submersible Pump Problems
An electric submersible pump can lose performance because of gas locking, gas interference, worn stages, solids erosion, scale, cable faults, motor issues, or operation far from its efficient range. Falling intake pressure or a changed fluid level can alter pump conditions quickly.
Surface electrical data are valuable but not definitive. A current change may suggest altered load, yet the root cause could still be fluid composition, intake conditions, mechanical wear, or a restriction elsewhere in the system.
🪝 Rod-Pump Failures and Poor Fillage
Rod-pumped wells may suffer from parted rods, leaking traveling or standing valves, worn pumps, tubing leaks, fluid pound, or poor pump fillage. Poor fillage occurs when the pump has insufficient fluid entering it during the stroke.
Dynamometer cards, acoustic fluid-level shots, pump-off control data, and well-test information help identify whether the pump is failing mechanically or simply being operated faster than the reservoir can supply fluid.
🎈 Gas Lift Instability
Gas lift requires a suitable injection-gas supply, valve performance, operating pressure, and tubing-casing pressure relationship. Changes in injection rate, compressor availability, valve behavior, or flowing conditions can shift the well away from its intended operating point.
A well may produce less because it receives too little lift gas, but too much gas can also create friction losses, unstable flow, or inefficient lifting. Optimization requires measured pressures and rates rather than a simple assumption that more injection gas is always better.
🚧 Tubing, Choke, and Flowline Restrictions
Not every restriction is downhole. A partially closed choke, plugged bean, collapsed tubing, hydrates, waxed flowline, separator backpressure, or high gathering-system pressure can reduce a well’s rate.
Compare wellhead pressure, choke setting, downstream line pressure, and separator conditions before planning a workover. A hypothetical well with unchanged downhole inflow but elevated flowline pressure may show a major rate loss that can be corrected entirely at surface.
🌡️ Temperature and Hydrate Effects
Hydrates are ice-like crystalline solids that can form when water and light hydrocarbons coexist under suitable low-temperature, high-pressure conditions. They can restrict flow in subsea systems, cold flowlines, and some surface equipment.
Temperature changes also influence viscosity, wax behavior, and emulsion stability. A decline that follows a process upset, insulation failure, or extended cold shut-in should prompt a review of thermal conditions alongside pressure data.
🧴 Emulsions and Viscosity Changes
An emulsion is a dispersion of one liquid in another, such as water droplets dispersed in oil. Stable emulsions can increase apparent viscosity, impair separation, and create additional pressure losses through the tubing and facilities.
Fluid behavior may change after water breakthrough, chemical dosage changes, or mixing of incompatible fluids. Bottle tests and representative sampling can be more informative than judging emulsion severity from appearance alone.
🧯 Corrosion, Erosion, and Solids Production
Corrosion can create metal loss, leaks, and debris, while erosion can damage chokes, valves, and pump components at high fluid velocities. Sand and other formation solids can plug perforations, erode equipment, or accumulate in the wellbore.
Solids management is a balance. Aggressive sand production may threaten equipment integrity, but excessive sand control can restrict flow. Monitoring produced solids, pressure behavior, and equipment condition helps select an appropriate control strategy.
🧠 Reservoir Compartmentalization
Faults, sealing shale layers, stratigraphic barriers, and low-connectivity rock can divide a reservoir into compartments. A well may drain a small connected volume and decline earlier than expected even though oil remains elsewhere in the field.
Pressure interference tests, seismic interpretation, geological models, tracer information, and cross-well production behavior can provide clues. This is a reminder that a field-average pressure may not represent the pressure in a specific well’s drainage area.
💉 Injection Changes and Offset-Well Interference
Changes in nearby injection or production can alter pressure gradients and fluid movement. An injector may improve pressure support in one area while accelerating water arrival in another, especially where high-permeability paths or fractures exist.
Offset wells can also compete for the same drainage volume. Correlate decline timing with nearby rate changes, injection volumes, pressures, and completion intervals, but avoid assigning blame without a plausible subsurface flow path.
📊 Use a Diagnostic Evidence Matrix
No single indicator uniquely identifies the cause of a decline. A useful practice is to match symptoms with several independent observations before choosing an intervention.
| Observed pattern | Possible explanation | Helpful follow-up |
|---|---|---|
| Oil and total liquid both fall suddenly | Lift failure, restriction, shut-in damage | Check run time, pressures, lift diagnostics, recent events |
| Oil falls while water rises | Water breakthrough, coning, channeling | Review water chemistry, production logs, interval contribution |
| Oil falls and gas-oil ratio rises | Gas liberation, gas coning, lift instability | Compare pressure data, fluid level, and lift-gas conditions |
| Rate falls with higher upstream pressure | Choke, tubing, flowline, or facility restriction | Inspect pressure profile and downstream constraints |
The matrix is not a substitute for engineering judgment. It helps prevent a common error: interpreting one production trend as proof of one mechanism.
🧾 Build a Minimum Data Set Before Intervention
A sound investigation usually begins with the cheapest, least intrusive evidence. Gather recent production tests, allocation data, flowing pressures, static pressures where available, water cut, gas-oil ratio, chemical records, lift-system data, and a clear event timeline.
- Verify meter and test quality before accepting a rate change.
- Compare the well with its own historical behavior, not only with field averages.
- Review nearby wells and injection patterns for simultaneous changes.
- Preserve fluid and deposit samples when solids or deposits are suspected.
- Define the decision that each new log, test, or intervention is meant to support.
⚠️ Common Diagnostic Mistakes
One common mistake is treating a production decline with the same solution used last time. Acidizing a well with a surface restriction, or increasing pump speed in a reservoir-limited well, can waste money and create new operational problems.
Another is confusing correlation with cause. A water-cut increase after a choke change may reflect a real reservoir trend, a changed drawdown, altered test conditions, or several effects at once. Good surveillance makes uncertainty explicit instead of hiding it.
🔧 Match the Remedy to the Mechanism
The best response depends on the confirmed or most probable restriction. Mechanical restrictions may require cleanout, repair, replacement, or flowline work. Deposits may require targeted chemical, thermal, or mechanical removal. Reservoir impairment may call for a compatible stimulation treatment.
Water and gas problems require extra caution because a short-term rate gain can worsen unwanted-fluid production. Candidate treatments should be screened against well integrity, reservoir architecture, fluid compatibility, environmental controls, economics, and the likelihood that the benefit will persist.
📈 Surveillance That Catches Problems Earlier
Unexpected declines are easier to manage when baseline behavior is well documented. Consistent well tests, pressure monitoring, fluid-level measurements, lift surveillance, water chemistry, and chemical-treatment records create the context needed to spot meaningful changes.
Trend the relationships, not only the rates: rate versus drawdown, water cut versus liquid rate, gas-oil ratio versus pressure, and pump performance versus fluid level. A stable production rate can still conceal a growing restriction if operators are steadily increasing drawdown to maintain it.
🤝 Integrate Reservoir, Production, and Operations Knowledge
Decline diagnosis crosses disciplines. Reservoir engineers interpret pressure support and connectivity; production engineers assess inflow and lift; operations teams recognize equipment behavior and recent changes; geoscientists explain layering, faults, and fluid contacts.
The strongest conclusions come when these views are tested against the same data set. A practical review meeting should end with ranked hypotheses, evidence gaps, low-risk checks, and clear criteria for escalating to a workover or subsurface intervention.
🎯 The Core Principle: Find the Bottleneck
An oil well is a flow system extending from reservoir pores to export facilities. Production falls when one or more parts of that system lose capacity: the reservoir cannot deliver fluid, the near-wellbore region is damaged, the completion is restricted, the lift system is ineffective, or surface backpressure is too high.
The central task is to locate the controlling bottleneck and understand whether it is temporary, progressive, mechanical, chemical, or reservoir-driven. That approach turns an alarming rate decline into a structured engineering problem with testable explanations.
Unexpected production decline is rarely solved by guessing; it is solved by verifying the data, tracing the pressure and flow path, and treating the specific bottleneck that limits the well. A well may be declining, but the reason—and the recoverable opportunity—often remains within reach. 🛢️📉🔍