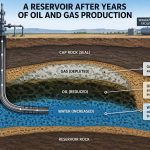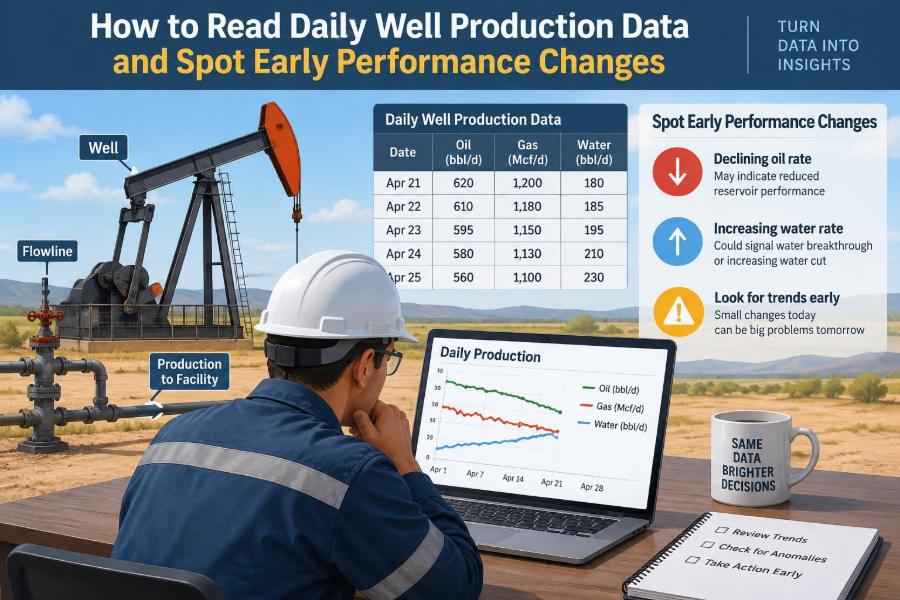

A morning production report can look deceptively simple: a few rates, a few hours online, perhaps a note from the operator. Yet a small change in those numbers may be the first visible sign of a loading well, a failing artificial-lift component, a separator constraint, a meter problem, or simply a different choke setting.
For the production engineer, operator, and field technician, the challenge is not merely finding yesterday’s oil rate. It is deciding whether the change is real, whether it matters, and what should be checked before a manageable issue becomes deferred production or an unsafe operating condition.
Daily data are noisy. Wells cycle, facilities interrupt flow, allocations are revised, and tests are imperfect. Reading the data well means combining disciplined trend review with knowledge of the well, the lift system, and the surface network.
This guide builds a practical workflow for turning a daily production report into early, defensible observations—and then into the right next question.
🧭 Start with the purpose of daily surveillance
Daily surveillance is an early-warning process, not a monthly accounting exercise. Its purpose is to identify deviations from expected well behavior while there is still time to verify the cause and respond proportionately.
A useful review asks three questions: What changed? Is the change trustworthy? What mechanism could explain it? Those questions prevent an analyst from reacting to every fluctuation while still catching meaningful deterioration.
📋 Know what one daily record actually represents
A daily record may be a direct well test, a calculated allocation from commingled production, a tank measurement, or a historian value derived from several instruments. These are not equally certain.
Before comparing days, learn the reporting basis. A rate marked as “allocated” is often useful for trend screening, but a suspected well problem may require a current, representative well test before operational decisions are made.
⏱️ Separate production rate from produced volume
Rate is production per unit time, such as barrels of liquid per day or standard cubic feet of gas per day. Volume is the total amount recorded over a reporting period. Confusing them can create false alarms.
A well producing 100 barrels during 12 flowing hours did not average 100 barrels per day over the calendar day. Its normalized flowing rate is 200 barrels per flowing day, while its calendar-day volume is still 100 barrels.
🗓️ Check uptime before interpreting a decline
Uptime, sometimes called runtime or onstream time, is the fraction of the day the well was actually capable of flowing or pumping. A lower calendar-day volume may simply reflect a shutdown, power interruption, planned test, or facility trip.
Always place hours online beside oil, water, and gas volumes. If uptime changed, normalize where appropriate and read the operations log. A true performance decline is easier to see once lost operating time is removed.
🛢️ Read oil, water, and gas together
No fluid stream should be interpreted in isolation. Oil, water, and gas often respond differently to reservoir changes, lift performance, flow restrictions, and measurement issues.
For example, falling oil with stable water and gas may indicate reduced liquid handling or a changing allocation. Falling oil and gas together can point toward reduced inflow, lower drawdown, or a surface restriction. The pattern matters more than any single number.
🧮 Use the right basic ratios
Ratios turn raw streams into diagnostic clues. Water cut is water divided by total liquid, gas-oil ratio is gas divided by oil, and liquid rate is oil plus water on a consistent reporting basis.
| Indicator | What a shift may suggest | Important caution |
|---|---|---|
| Water cut rises | More water contribution, changing inflow, or liquid-handling issue | Confirm rates and test quality first |
| Gas-oil ratio rises | Gas breakthrough, lower flowing pressure, gas interference, or allocation effect | Consider choke and separator conditions |
| Liquid rate falls | Reduced inflow, lift loss, restriction, or downtime | Separate oil and water response |
| Stable total liquid, lower oil | Higher water fraction or allocation change | Review water measurement and test method |
Ratios can become unstable at very low rates. A small measurement error in oil can produce a large apparent gas-oil-ratio change, so use them as prompts for investigation rather than automatic diagnoses.
📈 Compare against an expected trend, not yesterday alone
Most wells naturally decline over time, particularly after peak production. Comparing today only with yesterday can turn routine variability into unnecessary alarms.
Use an expected operating envelope based on recent stable performance, decline behavior, and known operating conditions. A rolling average can help, but do not let averaging hide a sharp and persistent step change.
🔎 Look for steps, slopes, and scatter
Three visual patterns are especially useful. A step change is a sudden, sustained move after an event. A slope change is a gradual acceleration in decline or rise in water cut. Scatter is irregular variation that may reflect unstable operation or poor data quality.
A chart often reveals these patterns faster than a spreadsheet column. Plot oil, water, gas, uptime, choke, and key pressure or lift variables on aligned dates whenever data systems allow.
🧪 Confirm the measurement chain
Unexpected data should first be treated as a measurement question, not a reservoir conclusion. Check the test separator, multiphase meter, tank gauges, flow computer status, allocation logic, sampling, and any recent calibration or maintenance notes.
A physical well problem can coexist with bad data, but acting on an unverified number can waste field time and create unnecessary intervention risk. Trace the value from the report back to its source.
🚦 Distinguish a one-day anomaly from a persistent signal
One unusual day deserves context; several consistent days deserve attention. Persistence is a powerful filter because many reporting disturbances disappear once the well returns to normal operating conditions.
There is no universal number of days that proves a change. The appropriate response depends on well value, measurement confidence, operating risk, and how quickly the suspected failure mode can worsen. High-consequence wells should have tighter review thresholds.
📝 Treat operator notes as engineering data
Notes such as “flowline flushed,” “separator upset,” “power reset,” “choke changed,” or “well unloaded” can explain a chart immediately. They also help distinguish cause from coincidence.
Encourage concise, time-stamped notes that describe what happened, when it happened, and what was adjusted. A vague “well checked” note is much less useful than “pump speed reduced after high motor load alarm.”
🎛️ Account for choke and surface-pressure changes
A choke change changes the restriction between the well and the downstream system. Depending on the well and facility, opening a choke may raise rate, lower upstream pressure, increase sand risk, or destabilize flow. The response is not identical in every well.
Record choke size or position alongside tubing pressure, flowline pressure, and separator pressure. If rate changed immediately after a choke adjustment, avoid calling it reservoir decline before comparing conditions.
🌡️ Read pressures as a connected system
Wellhead, tubing, casing, flowline, and separator pressures each describe part of the flow path. Their value lies largely in their relationships and trends, not in a single isolated reading.
For instance, rising upstream pressure with falling rate can be consistent with a downstream restriction. Falling flowing pressure with falling rate may instead suggest declining reservoir support, altered choke conditions, or changes in artificial lift. Gauge location and data quality must be understood before drawing conclusions.
🧱 Watch for flowline and facility constraints
A well can appear to underperform even when the reservoir and downhole equipment are unchanged. Restrictions from wax, scale, hydrates, liquid accumulation, plugged strainers, partially closed valves, or high separator pressure can reduce deliverability.
Compare neighboring wells on the same gathering system. If several wells shift together, the common facility or export path deserves attention before individual well diagnoses.
🪨 Recognize possible reservoir-driven changes
Gradual decline is often consistent with changing reservoir pressure and productivity, but daily data alone cannot confirm a reservoir mechanism. Increased water production, changing gas-oil ratio, offset activity, and pressure surveillance may add context.
A reservoir-driven explanation becomes more credible when the change persists across reliable measurements and cannot be linked to downtime, surface conditions, or lift settings. It should remain a working hypothesis until supported by suitable surveillance.
💧 Interpret water behavior carefully
A rising water cut can reflect changing inflow from the reservoir, coning, channeling, completion communication, or simply a falling oil rate with nearly unchanged water. It can also arise from test or allocation uncertainty.
Check both water rate and water cut. A higher percentage does not necessarily mean more water volume; it may mean oil fell faster than water. This distinction affects whether the next action is a water-management review, a lift check, or measurement verification.
💨 Use gas behavior to identify operating clues
Gas rate and gas-oil ratio can respond to reservoir gas liberation, gas breakthrough, changing drawdown, separator conditions, and gas interference in artificial-lift systems. A sharp gas change without an operational explanation deserves review.
For gas-lifted wells, gas data require extra care. Distinguish produced gas from injected gas, confirm allocation conventions, and review injection rate and injection pressure before attributing a gas-oil-ratio shift to the reservoir.
⚙️ Match the review to the artificial-lift method
Artificial lift adds diagnostic variables that can reveal trouble earlier than production rate alone. The daily report should therefore include the few lift measurements most relevant to the installed system.
Common examples
- Rod lift: runtime, strokes per minute, fluid level, pump fillage where available, polished-rod load data, and electrical load.
- Electric submersible pump: frequency, motor current, voltage, intake pressure or temperature where available, vibration alarms, and starts or trips.
- Gas lift: injection rate, injection pressure, casing pressure, operating valve behavior, and available injection-gas supply.
- Progressing cavity pump: speed, torque, drive load, temperature, and evidence of solids or elastomer-related limitations.
A falling rate is not automatically a pump failure. It may be insufficient inflow, gas interference, a changing backpressure, or intentional setpoint control.
🔌 Spot early electrical and power-related warnings
Repeated starts, short runtime, intermittent trips, changing motor current, and unstable drive readings may appear before production volumes show a clear monthly effect. These signals should be reviewed with maintenance and control-system records.
Do not interpret electrical data without knowing normal ranges for that installation. A current change can result from pump loading, voltage variation, speed adjustment, fluid property changes, or instrumentation error.
🧹 Consider solids, scale, wax, and emulsions
Restrictions often develop gradually. A well may show rising pressure upstream of a restriction, falling liquid rate, more frequent cleanup work, or unstable test results. The exact signature depends on where the material accumulates.
Field observations matter here: produced solids, temperature changes, chemical-injection interruptions, differential pressure across equipment, and recurring cleanout history can make a suspected mechanism more credible.
🔄 Compare the well with its peer group
Peer comparison is a practical way to separate well-specific behavior from shared operating conditions. Useful peers may share reservoir interval, lift type, completion style, gathering line, or facility.
Do not compare every well to every other well. A high-water mature producer and a recently completed oil well may have similar locations but very different expected behavior. Choose peers for a clear technical reason.
🧠 Build a simple daily review sequence
A repeatable sequence reduces missed clues and prevents premature conclusions. The goal is not to inspect every available tag with equal intensity; it is to focus effort where the data indicate change.
- Check data completeness, uptime, and report status.
- Compare oil, water, gas, and liquid against the expected trend.
- Review ratios and key operating settings.
- Read operator, maintenance, and facility notes.
- Check pressures and lift-system indicators.
- Compare with relevant peers and common infrastructure.
- Classify the issue: data, operations, facility, lift, reservoir, or unresolved.
- Assign a verification action and a review date.
🏷️ Use clear exception categories
Classifying exceptions creates consistency across shifts and teams. It also prevents a data-quality issue from being buried in a general “low production” list.
- Data exception: missing, implausible, or unverified measurement.
- Operational exception: downtime, changed setpoint, choke movement, or planned activity.
- Facility exception: separator, compression, export, or flowline limitation.
- Well-performance exception: sustained deviation needing diagnosis.
- Integrity or safety exception: condition requiring prompt escalation under site procedures.
Categories are not diagnoses. They are a disciplined way to direct the next check.
📣 Escalate based on consequence, not curiosity alone
Not every deviation needs the same response. A modest rate change on a stable, low-risk well may justify monitoring and a future test. A similar shift accompanied by abnormal pressure, repeated trips, leaks, produced sand, or integrity indicators may require immediate communication under the operating company’s procedures.
Daily surveillance must never replace safety systems, alarm response, integrity management, or field judgment. When safety or containment is uncertain, follow the established escalation path rather than waiting for a cleaner trend.
🧾 Document observations without overstating certainty
Good surveillance notes separate facts from interpretations. Write: “Oil allocation declined while uptime remained high; tubing pressure increased; choke unchanged; well test requested.” Avoid: “Formation damage confirmed” unless evidence truly supports that conclusion.
This wording makes handovers stronger and allows later reviewers to understand why an action was requested. It also keeps hypotheses open when several mechanisms remain plausible.
🧩 Work through a hypothetical daily-data example
Imagine a rod-pumped well whose allocated oil falls over several days while water remains nearly steady. Calendar uptime is high, the choke is unchanged, and the field notes show no facility outage. Water cut rises because the oil component is lower, not because water volume surged.
The next review finds reduced pump runtime and a change in electrical load. That combination supports a lift-system check more strongly than an immediate reservoir conclusion. A fluid-level measurement, controller review, and representative test may then determine whether the pump is underfilled, cycling, or facing another operating constraint.
This is a hypothetical example, not a universal diagnostic rule. The value lies in the sequence: verify the data, identify the pattern, connect it to operating evidence, then choose the least intrusive useful check.
🚫 Avoid common surveillance mistakes
Several habits repeatedly weaken daily review:
- Reacting to a single allocated rate without checking uptime or test status.
- Calling every rate loss a reservoir decline.
- Using water cut without reviewing water rate.
- Ignoring a choke, separator, or lift-setpoint change.
- Comparing wells with incompatible operating conditions.
- Allowing unresolved exceptions to remain open without an owner or due date.
The remedy is not more dashboards by themselves. It is a consistent reasoning process supported by reliable data and clear communication.
🖥️ Use automation to find, not explain, anomalies
Trend rules, control charts, and exception dashboards can scan large well populations far faster than manual review. They are especially useful for highlighting rate shifts, missing data, unusual downtime, and deviations from an expected envelope.
Automation still needs operational context. A model may flag a deliberate choke change as an anomaly and miss a slowly worsening restriction if the threshold is poorly chosen. Keep human review in the loop, particularly for high-value or high-risk wells.
🛠️ Improve the quality of the daily dataset
Better decisions begin upstream of the report. Standardize tags and units, capture downtime causes, time-stamp operational changes, maintain calibration records, and make critical notes accessible to the people reviewing trends.
A short list of dependable variables is often more valuable than a large list of inconsistent ones. Build confidence in oil, water, gas, uptime, pressures, lift settings, test status, and event logs before adding sophisticated analytics.
🤝 Make surveillance a cross-functional habit
Production surveillance works best when operations, production engineering, facilities, maintenance, reservoir teams, and measurement specialists can quickly share context. The operator may see unstable flow; maintenance may know of recurring trips; the engineer may recognize a declining productivity pattern.
Regular exception review should produce visible decisions: monitor, test, inspect, adjust under approved procedures, plan work, or close as data error. A list of observations without ownership rarely protects production for long.
🎯 Focus on changes that are real, relevant, and explainable
The central skill in reading daily well data is not memorizing a single “normal” rate or ratio. It is recognizing a change against the well’s own operating context, testing whether the signal is reliable, and linking the pattern to credible mechanisms.
Start with uptime and measurement quality. Then examine the combined behavior of oil, water, gas, pressures, surface conditions, and artificial lift. Escalate according to consequence, document uncertainty honestly, and verify with the most appropriate field observation or test.
The best daily surveillance does not claim to predict every failure; it turns small, trustworthy deviations into timely questions and practical actions. 🛢️📈🔧