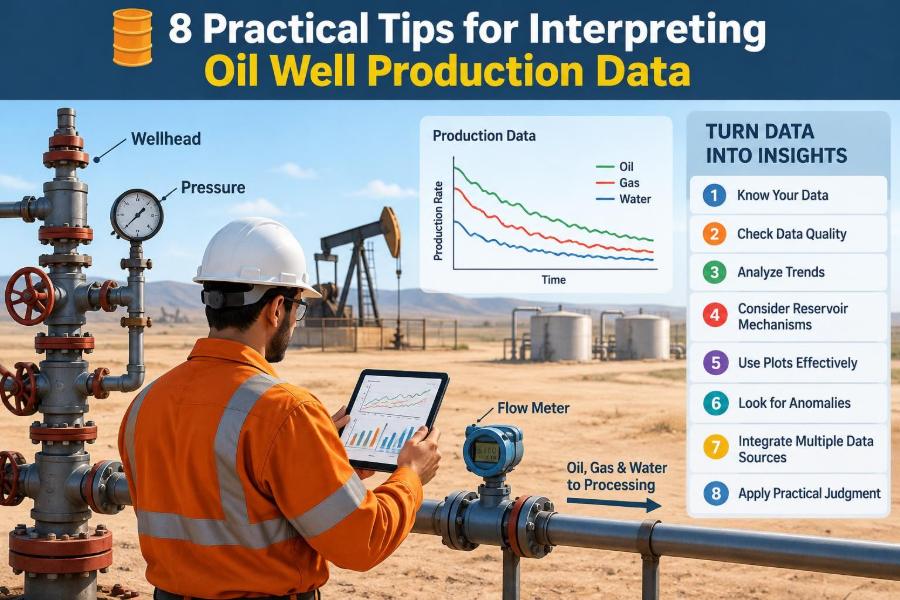

A production report arrives in the morning: oil is down, water is up, and gas has moved enough to attract attention. The immediate question is usually simple—what changed? The useful answer rarely is.
A well’s daily numbers are the visible result of reservoir behavior, fluid flow, artificial lift, surface constraints, operating practices, and measurement quality. Reading a single rate without that context can lead to an unnecessary intervention, a missed equipment problem, or an overly optimistic forecast.
For students, production data can feel like a spreadsheet exercise. For operating teams, it is a decision tool that may affect surveillance priorities, deferment reporting, chemical treatments, workovers, and reservoir-management plans.
The goal is not to make every decline look alarming or every increase look encouraging. It is to build a repeatable way to separate signal from noise, ask better questions, and know when the data support action.
🧭 Start with the decision, not the chart
Before plotting anything, define the decision the analysis is meant to support. Are you diagnosing a sudden loss, estimating a forecast, screening candidates for intervention, checking allocation, or tracking a water-management issue?
The same oil-rate trend can mean different things in different decisions. A gradual decline may be acceptable for a forecast but still justify an artificial-lift review if production is approaching an operating limit.
Write a short question such as: Did the well lose productive capacity, or was production constrained at the surface? This prevents an analysis from becoming a collection of charts with no operational conclusion.
📚 Know what each production number actually represents
Production data are commonly reported as oil rate, water rate, gas rate, total liquid rate, flowing pressure, choke setting, operating hours, and downtime. None should be interpreted as a universal measure of well performance.
Oil rate is the produced oil volume divided by a reporting period. It may be an allocated value rather than a directly measured value. Total liquid rate combines oil and water and often matters for pump loading, fluid handling, and drawdown.
Ask whether the rate is a test rate, a measured separator rate, an allocated rate, or a calculated value. That distinction determines how much confidence to place in small changes.
🕒 Normalize for time on production
A monthly oil volume does not automatically mean a monthly production rate. A well that produced for 15 days and delivered 1,500 barrels had a very different operating result from one that delivered the same volume over 30 days.
Use producing time when available:
Average producing rate = produced volume / producing hours or days
Also retain calendar-day performance. Calendar-day rate captures the commercial effect of downtime, while producing-day rate helps distinguish downtime from reduced well capacity.
A practical review often needs both. If calendar-day oil falls while producing-day oil remains stable, the main issue may be availability rather than reservoir or lift performance.
🧪 Tip 1: Validate the data before interpreting it
The first practical rule is simple: do not diagnose the reservoir from unverified measurements. A surprising trend may be real, but it may also come from a meter issue, incorrect allocation factor, tank gauging error, changed test frequency, or data-entry problem.
Check whether a new value is physically plausible against nearby dates, operating notes, and related variables. If reported oil falls sharply while liquid, pressure, choke, and hours remain unchanged, verification is warranted before recommending a workover.
- Look for impossible or inconsistent units.
- Identify missing, repeated, or zero values.
- Compare daily data with well tests and facility totals.
- Confirm whether processing or allocation methods changed.
Data cleaning is not administrative housekeeping. It is part of engineering judgment.
🔍 Distinguish measured, allocated, and estimated volumes
A test separator can provide a relatively direct snapshot of a well’s fluids under specific conditions. In commingled production systems, however, individual well volumes may be allocated from group measurements using tests, historical factors, or models.
Allocated values are useful for routine surveillance, but they can lag a rapid well change. A well with a changing water cut may be especially difficult to allocate accurately when test intervals are long.
Label the source in your working file. Treat a one-day shift in an estimated allocation differently from a repeated change confirmed by well tests, tank data, or multiphase metering.
🧱 Establish a reliable baseline
A baseline is not merely the first rate in the dataset. It is a period of reasonably stable, understood operation against which later behavior can be compared.
Include the typical oil, water, gas, liquid rate, flowing pressure, choke, lift setting, operating hours, and relevant facility conditions. If possible, select a period after cleanup and before a known operational upset.
For example, comparing today’s rate with the first month after completion may exaggerate apparent underperformance if that early period included transient cleanup flow. A recent stable operating window is usually more useful for surveillance.
📈 Plot rates before ratios
Ratios are compact and informative, but raw component rates show what is actually changing. Plot oil, water, gas, and total liquid together before relying on water cut or gas-oil ratio.
Consider a hypothetical well with stable water rate and falling oil rate. Water cut rises even though the well is not producing more water. The engineering response may focus on declining oil productivity, not necessarily water breakthrough.
Conversely, rising water rate with stable oil points more directly toward increasing water contribution, changing conformance, or a completion-related issue. Component rates prevent ratios from telling only half the story.
💧 Read water cut in context
Water cut is the water fraction of total produced liquid:
Water cut = water rate / (oil rate + water rate)
It affects fluid-handling costs, pump loading, emulsion behavior, disposal capacity, and economic limits. It can also provide clues about reservoir sweep, nearby water influx, channeling, or completion problems.
Yet water cut alone does not identify the cause. A changing test method, production from a different interval, or an oil-rate decline can move the percentage. Pair it with water rate, liquid rate, pressure, and completion history.
🔥 Interpret gas-oil ratio carefully
Gas-oil ratio, or GOR, is gas produced per unit of oil produced. A rising GOR can reflect solution-gas liberation as pressure falls, gas coning, gas breakthrough, changing choke conditions, separator conditions, or measurement and allocation effects.
It is tempting to call every GOR increase a reservoir warning. That can be misleading when gas measurement is uncertain or when separator pressure has changed. Review gas rate and oil rate separately, then check the operating context.
A rapid, sustained gas-rate rise with declining oil and stable operating conditions may deserve closer diagnosis. A single isolated ratio spike usually deserves data validation first.
⚖️ Use mass balance as a reasonableness check
Production data should broadly agree with the physical system. If a well’s total liquid appears to double but pump speed, power load, flowing pressure, and facility measurements do not change, investigate the data pathway.
Simple cross-checks are powerful: oil plus water should equal liquid on the same reporting basis, and accumulated daily volumes should be compatible with reported monthly totals after accounting for uptime and reporting cutoffs.
This is not a full reservoir material-balance calculation. It is a practical habit of asking whether numbers can coexist without violating basic operational logic.
🗓️ Choose the right time scale
Daily data reveal trips, slugging, shut-ins, and rapid equipment changes, but they can be noisy. Monthly data smooth operational noise but may hide the sequence of events that caused a loss.
Use multiple scales rather than searching for one perfect plot. Daily data are often best for troubleshooting; weekly or monthly averages can clarify underlying trends; cumulative plots help place short-term changes in a longer production history.
When a trend appears only at one time scale, ask whether averaging or data gaps are creating the impression.
🛠️ Separate downtime from deliverability loss
A well can produce less because it ran less, because it could not flow as well when running, or because both occurred. These are fundamentally different problems.
Use event codes, maintenance records, run-time signals, and operator notes. A pump-off controller may deliberately cycle a rod-pumped well, while a facility shutdown may affect several wells at once.
Do not describe all lost volume as “decline.” Downtime is an availability problem; lower producing-day rate is a capacity or operating-condition problem. The remedies, owners, and economics may differ.
🏭 Check the facility before blaming the well
Surface restrictions can create production behavior that looks like a downhole issue. Examples include high separator pressure, restricted flowlines, closed or partially closed valves, separator upsets, export constraints, and limited water-handling capacity.
Compare wells sharing the same facility. If several wells change on the same date, a common surface condition is often more plausible than simultaneous reservoir changes.
Field-wide context also helps identify reporting issues. A total facility volume shift after an allocation-system update may explain apparent well changes that have no physical counterpart.
🧯 Look for operating changes and interventions
Production trends must be annotated. Choke adjustments, pump-speed changes, gas-lift valve work, chemical treatments, acid stimulation, scale removal, workovers, and recompletions can all alter rates.
Maintain an event timeline beside the production plot. Include dates, what changed, intended operating condition, and whether the well was stabilized before the next test.
Without this history, an analyst may credit an intervention for a response that began earlier—or mistake normal post-shut-in behavior for sustained improvement.
🔧 Tip 2: Compare like with like after operational changes
After a choke change or lift adjustment, compare performance at similar operating conditions. Comparing a restricted well before an adjustment with an unrestricted well afterward does not isolate reservoir improvement.
For a flowing well, note choke size, upstream and downstream pressure, and separator conditions. For an artificially lifted well, record the relevant lift settings, run time, and constraints.
When conditions cannot be matched exactly, state the limitation clearly. A response can still be operationally useful, but it should not be presented as a precise measure of formation damage removal or reserve addition.
🪜 Connect artificial lift to the production trend
Artificial lift changes the relationship between reservoir inflow and surface production. A falling oil rate may reflect declining inflow, inefficient lift, gas interference, mechanical wear, fluid level changes, or intentional control settings.
For rod-pumped wells, consider stroke, speed, pump fillage, fluid level, dynamometer information where available, and run time. For electrical submersible pumps, review frequency, intake pressure, motor behavior, gas handling, and operating envelope.
A well is not necessarily “out of reservoir” because its pump is underperforming. Equally, increasing pump speed may not help a well whose inflow is already limited.
🎈 Interpret pressure with measurement conditions attached
Pressure is informative only when its location, gauge quality, and flow condition are known. Flowing tubing pressure, casing pressure, wellhead pressure, separator pressure, and static reservoir pressure answer different questions.
A lower wellhead pressure can indicate reduced backpressure, but it may also result from a different choke, pipeline condition, or gauge. A pressure point without an associated rate and operating state is incomplete evidence.
When comparing pressure trends, use consistent measurement locations and units. Note whether readings were taken while the well was stable, transient, flowing, or shut in.
🧬 Understand decline without forcing a curve
Decline curve analysis uses historical rate behavior to estimate future production, commonly through exponential, harmonic, or hyperbolic forms. It is valuable, but it is not a substitute for understanding why the well is declining.
Changes in choke, lift, downtime, offset activity, water handling, or workovers can make a fitted decline reflect operations rather than reservoir depletion. A mathematically smooth curve may therefore be operationally misleading.
Use decline analysis on periods with sufficiently consistent conditions. Treat forecasts as scenarios that depend on assumptions, not as fixed outcomes.
📉 Tip 3: Use cumulative production to add perspective
Cumulative oil, water, and gas plots help answer whether a recent shift is large relative to the well’s production history. They also reveal data discontinuities that may be hard to see in daily rates.
An abrupt change in the slope of cumulative oil can signal a sustained performance change. A small zigzag in daily data may disappear entirely at cumulative scale, showing that it had little long-term effect.
Cumulative plots are especially useful for reconciling reporting periods, evaluating intervention timing, and communicating performance to non-specialists. They should complement, not replace, rate and uptime analysis.
🧩 Use neighboring wells as context, not proof
Offset wells can provide valuable context. Similar changes across nearby wells may suggest facility constraints, field pressure trends, shared injection effects, or a common reporting problem.
But wells are rarely identical. They may differ in completion interval, perforation quality, lift method, drainage area, orientation, and operating strategy. A nearby well’s response is evidence to investigate, not proof of causation.
Compare the variables that matter: start dates, completion depth, rate history, water behavior, pressures, interventions, and infrastructure connections.
🌊 Tip 4: Treat water changes as a diagnostic problem
When water increases, resist jumping straight to “water breakthrough.” First ask whether the increase is real, sustained, and associated with a change in water rate, oil rate, liquid rate, pressure, or operating conditions.
Possible explanations can include reservoir water influx, fracture or high-permeability channeling, coning, behind-pipe communication, a change in contributing perforations, or a measurement issue. These mechanisms have different signatures and require different evidence.
Useful follow-up may include a stabilized well test, production logging where justified, pressure review, tracer or surveillance data where available, and a careful reconstruction of completion and intervention history.
🫧 Tip 5: Investigate gas changes without assuming breakthrough
A gas increase can be operationally significant because gas affects lift efficiency, separator capacity, line pressure, metering, and safety systems. It may also contain reservoir information, but the diagnosis should be disciplined.
Review whether the oil decline is denominator-driven, whether choke or separator conditions changed, and whether gas measurements are consistent. For lifted wells, distinguish produced gas from injected gas and understand the allocation convention.
If gas behavior persists and aligns with pressure or offset evidence, broaden the review to reservoir communication and completion behavior. If it appears only in an isolated test, confirm the measurement first.
🧮 Calculate ratios, but preserve the raw data
Water cut, GOR, liquid-oil ratio, productivity indicators, and uptime are useful screening metrics. Their strength is compression: they make a changing relationship visible quickly.
Their weakness is that a ratio can change because either its numerator or denominator changed. Always keep component rates visible in the same review package.
| Metric | What it may reveal | Key caution |
|---|---|---|
| Water cut | Relative water contribution | Can rise when oil falls and water stays flat |
| GOR | Gas behavior relative to oil | Can be distorted by gas measurement or conditions |
| Uptime | Availability and deferred production | Does not measure flowing capacity |
| Liquid rate | Lift and handling demand | Does not show oil quality of the liquid stream |
🧷 Tip 6: Build an event-annotated surveillance plot
A useful standard plot often combines oil, water, gas, liquid, uptime, and selected pressure or lift variables. Add vertical markers for shut-ins, workovers, chemical jobs, choke changes, equipment failures, and facility events.
This turns a passive history into an investigative tool. A rate change that appears mysterious on a plain line chart may become understandable once an event marker shows a pump replacement two days earlier.
Keep annotations concise and traceable to operations records. If an event date is uncertain, mark it as uncertain rather than creating false precision.
🧠 Tip 7: Form competing explanations
Strong interpretation does not begin with a favorite answer. It creates a short list of plausible explanations and tests each against the available evidence.
For a hypothetical oil-rate decline, alternatives might include reduced uptime, higher backpressure, pump degradation, changed choke setting, worsening inflow, allocation error, or a combination of these.
- What observation supports this explanation?
- What observation would weaken it?
- What low-cost check could resolve the uncertainty?
This approach reduces confirmation bias and encourages proportionate surveillance before expensive intervention.
📋 Turn observations into a ranked diagnosis
After reviewing trends, summarize findings in operational language. Separate observations from interpretations: “producing-day liquid rate fell after pump speed was reduced” is an observation; “the reservoir lost productivity” is an interpretation.
Rank likely causes by evidence strength and decision consequence. Then specify the next action, the expected finding, and the condition that would change the plan.
A concise conclusion might state that a facility restriction is most likely, a pump issue remains possible, and a stabilized well test plus pressure check should occur before changing the completion or lift design.
💰 Consider economics and operational risk
Not every abnormal trend justifies immediate intervention. The value of restoring production must be weighed against diagnostic cost, deferred production, equipment risk, water disposal limits, safety requirements, and the chance that the suspected mechanism is wrong.
A low-cost gauge verification or well test may be more valuable than a rapid workover when uncertainty is high. Conversely, a recurring failure with clear evidence may justify prompt action even before every detail is known.
Interpretation supports decisions; it does not eliminate judgment, commercial constraints, or operating discipline.
🚫 Avoid common production-data traps
Several habits repeatedly weaken production reviews:
- Using calendar-day volumes as if the well ran continuously.
- Calling a one-point anomaly a trend.
- Interpreting ratios without component rates.
- Ignoring changes in test, allocation, or facility conditions.
- Fitting a decline curve across workovers and operating changes.
- Assuming correlation between two trends proves a reservoir mechanism.
The remedy is not excessive analysis. It is a consistent workflow that documents data quality, time basis, operating state, and uncertainty.
🗂️ Create a repeatable well-review checklist
A review checklist makes good practice faster and easier to hand over between engineers. It also helps students learn which questions should become routine rather than improvised.
- Confirm data source, units, and reporting basis.
- Check uptime and downtime events.
- Plot oil, water, gas, liquid, and cumulative volumes.
- Review pressures, choke, lift settings, and facility conditions.
- Annotate interventions and operating changes.
- Compare with appropriate offsets and field totals.
- State competing explanations, confidence, and next checks.
Adapt the checklist to the asset. A flowing offshore well, a rod-pumped onshore well, and a gas-lifted well will need different supporting variables.
🗣️ Communicate uncertainty clearly
Production interpretation often uses incomplete evidence. Clear communication means distinguishing what is measured, what is inferred, and what remains unknown.
Prefer language such as “consistent with,” “suggests,” “requires confirmation,” and “most likely under current evidence.” This is not weak language; it accurately reflects the limits of surveillance data.
Decision-makers benefit when uncertainty is paired with a practical next step. Saying what would confirm or refute a diagnosis is more useful than presenting a confident but unsupported conclusion.
🎯 Tip 8: Follow the trend, the context, and the physics
The eighth and most durable tip is to interpret no production value in isolation. A credible conclusion aligns the trend with run time, measurement quality, operating changes, facility behavior, artificial lift, pressure conditions, and plausible reservoir physics.
Start with the simplest explanation that fits the evidence, but do not stop there if the data disagree. Verify anomalies, compare like with like, preserve raw rates behind ratios, and escalate the diagnostic effort only when the potential decision justifies it.
That discipline turns production data from a reporting requirement into a reliable surveillance system—one that helps teams protect value while avoiding premature conclusions.
The best oil well interpretation is not the fastest story about a changing rate; it is the most defensible explanation built from verified data, operating context, and physical reasoning. 🛢️📈🔧