
A well that has produced steadily for months begins to lose oil rate. At first, the decline looks ordinary. Then water handling rises, flowing pressure changes, and an operator notices that a pump is cycling more often than usual.
Traditionally, the full story may only become clear after production has already been lost: a visit to the lease, a well test, a fluid-level survey, a workover diagnosis, or a piece of equipment that finally fails. Each response takes time, people, and money—and some failures create safety or environmental exposure.
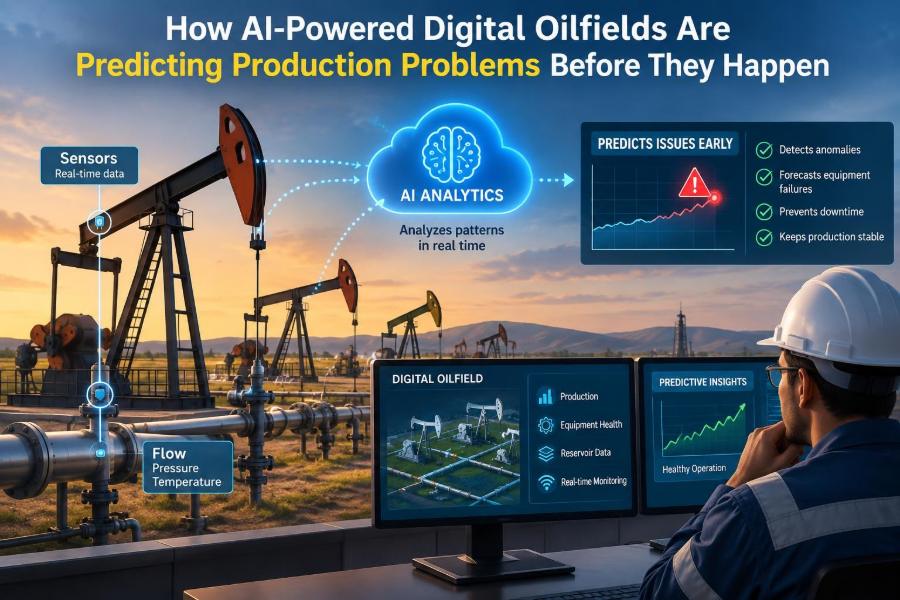
A digital oilfield aims to shorten that gap between a weak signal and a useful response. By combining field data, engineering knowledge, and artificial intelligence, it can flag patterns that suggest a production problem is developing before that problem becomes obvious.
This does not mean software can see the future with certainty. It means production teams can move from reacting to breakdowns toward investigating risk earlier, with better context and clearer priorities.
🛢️ What a Digital Oilfield Actually Means
A digital oilfield is not simply a field with sensors and dashboards. It is an operating approach in which data from wells, facilities, reservoirs, and maintenance activities is connected to decisions made by people.
The system may include field instrumentation, supervisory control and data acquisition (SCADA), production accounting, maintenance records, well files, and engineering models. The purpose is to create a usable picture of current performance rather than leaving vital clues in separate spreadsheets and databases.
AI is one layer within this broader system. It helps identify patterns in large, fast-moving, and often messy datasets that would be difficult for a person to review continuously.
🧠 Why Prediction Is Different From Monitoring
Monitoring answers, “What is happening now?” A pressure alarm, for example, may indicate that a separator pressure has crossed a set limit.
Predictive analytics asks a different question: “Given the way this variable and related variables are changing, what may happen next?” It may recognize that a gradual temperature rise, changing vibration signature, and altered motor current together resemble earlier pump failures.
Prediction is useful because many production problems have a developing phase. The goal is not to wait for a red alarm, but to identify an abnormal trajectory while intervention choices are still broader and less disruptive.
📡 The Field Data Behind Early Warnings
Digital oilfields use both real-time and slower-moving data. Real-time data can arrive every few seconds or minutes; laboratory results, well tests, and maintenance reports may arrive daily, weekly, or only after an event.
Common inputs include:
- Wellhead pressure, temperature, choke position, and flow rate
- Artificial-lift operating data, such as motor current, stroke rate, frequency, torque, or vibration
- Separator pressure, tank levels, chemical-injection rates, and compressor operating conditions
- Water cut, gas-oil ratio, fluid properties, and well-test results
- Work orders, failure reports, inspection notes, and downtime codes
- Reservoir, completion, and intervention history
A model is only as useful as the measurement context around it. A rate change means something different after a choke adjustment, a shut-in, a scale treatment, or a new pipeline constraint.
🧩 Turning Separate Signals Into Operational Context
A single tag rarely explains a production problem. A falling liquid rate might reflect reservoir decline, a restricted choke, a faulty meter, liquid loading, pump wear, or an upstream facility limitation.
Digital workflows connect signals so that the system can ask more sensible questions. Did the rate decline occur while drawdown increased? Did motor load change at the same time? Was there a recent control action? Are nearby wells seeing a similar response?
This context is why integration matters more than a visually impressive dashboard. Without it, teams may receive numerous alerts without knowing which ones deserve attention.
🧹 Why Data Quality Comes Before AI
Field data is frequently imperfect. Sensors drift, communications fail, tags are mislabeled, units differ, and a value can remain frozen even though the process has changed.
Before building a predictive model, teams need processes for validating ranges, detecting missing values, reconciling timestamps, and recording equipment configuration changes. A pump-speed tag interpreted in the wrong units can lead to a persuasive but incorrect conclusion.
Bad data does not become good data because an advanced algorithm uses it. In many projects, data cleaning and operational definitions require more effort than model training.
🔗 The Role of Historian and Event Data
A data historian stores time-series measurements from field and facility systems. It is valuable because many failures are preceded by a pattern over time rather than one unusual reading.
Event data adds the operational narrative: equipment was replaced, the well was shut in, a chemical program changed, or a flowline was pigged. These events help distinguish a meaningful anomaly from an expected response to work performed.
Maintenance records are especially valuable, but often difficult to use. Free-text descriptions, inconsistent failure codes, and incomplete close-out notes can make it hard to establish what actually failed and when.
📉 Detecting the Difference Between Decline and Trouble
All producing wells change. Reservoir depletion, changing water cut, and operating strategy can create gradual rate decline without indicating a fault.
AI models often establish a baseline for expected behavior under defined conditions. They then measure the residual: the difference between expected and observed performance. A persistent residual may be more informative than the production rate alone.
For example, if an oil well normally responds predictably to a given choke setting and flowing pressure, an unexpected departure may signal changing inflow performance, artificial-lift limitations, or measurement issues requiring review.
⚙️ Predicting Artificial-Lift Problems
Artificial lift is a natural starting point for predictive maintenance because equipment condition often affects measurable operating signals. The specific indicators depend on the lift method.
For an electric submersible pump, relevant patterns may involve motor current, intake pressure, frequency, temperature, vibration, and repeated trips. For rod lift, surface dynamometer data, motor loading, run time, and fluid level can help identify changed pump fillage or mechanical behavior.
The warning should not automatically diagnose a failure. It should state the evidence and likelihood clearly enough that an engineer can decide whether to adjust settings, collect a diagnostic survey, schedule a visit, or monitor more closely.
🌊 Recognizing Water Breakthrough Earlier
A rising water cut can reduce oil-handling efficiency and increase produced-water treatment and disposal demands. In some reservoirs, water production changes gradually; in others, it can shift sharply after a breakthrough path develops.
Models can compare water-cut changes with rates, pressures, injection patterns, offset-well behavior, and historical trends. This can help flag wells whose response differs from the local pattern.
However, allocation errors and separator or test limitations can distort water-cut data. A prediction should be checked against measurement confidence before it drives a costly conformance treatment or workover decision.
💨 Finding Gas-Handling Constraints
Gas production can create constraints far beyond the wellbore. Compression capacity, gathering-line pressure, separator performance, vapor recovery, and export limits can all restrict production.
A digital oilfield can detect a developing bottleneck by relating wellhead pressure, compressor load, suction and discharge conditions, flare activity where applicable, and production curtailment patterns. This enables teams to distinguish a well issue from a network issue.
That distinction matters. Opening a choke may not increase production if backpressure from the gathering system is the actual limiting factor.
🧪 Anticipating Scale, Wax, and Solids Risks
Flow assurance problems often develop through a combination of chemistry, temperature, pressure change, fluid composition, and operating history. Scale, wax deposition, sand production, and fines migration do not always produce one clear sensor signature.
Useful models combine process data with laboratory results, chemical-treatment records, pressure trends, and past intervention outcomes. The output may be a risk ranking rather than a precise prediction of deposit thickness.
In practice, a risk score can help prioritize sampling, chemical optimization, pigging, or inspection. It should support established integrity and chemical-management practices, not replace them.
🛠️ Using Condition Monitoring for Rotating Equipment
Surface equipment such as compressors, pumps, generators, and electric motors may produce warning signals through vibration, temperature, pressure, power consumption, or efficiency changes.
Condition monitoring models look for deviations from normal operating envelopes. A compressor drawing more power for similar throughput, for instance, may justify investigation of fouling, control problems, recirculation, or mechanical deterioration.
Operating conditions must be considered carefully. A machine working at a different speed, gas composition, ambient temperature, or suction pressure should not be compared blindly with its earlier duty.
🚨 Anomaly Detection and Failure Prediction Are Not the Same
Anomaly detection identifies behavior that appears unusual. It is often useful when a field has limited examples of known failures.
Failure prediction attempts to estimate the risk or timing of a specific failure mode, such as a pump trip or compressor shutdown. It requires reliable historical labels showing which conditions preceded that failure.
The distinction protects teams from overclaiming. An anomaly may be a sensor fault, a planned operational change, a new but harmless pattern, or the early stage of a real problem.
📊 Common Analytical Approaches
Different problems need different methods. The best approach is usually the simplest one that performs reliably, can be explained, and fits the available data.
| Approach | Best suited to | Key limitation |
|---|---|---|
| Rules and thresholds | Known operating limits and safety alerts | May miss subtle multi-variable patterns |
| Statistical trend models | Gradual changes and expected baselines | Can struggle after major operating changes |
| Machine-learning classifiers | Repeated, well-labeled failure modes | Need representative historical examples |
| Physics-based models | Flow, lift, and reservoir relationships | Depend on assumptions and calibration |
| Hybrid models | Complex systems with engineering constraints | Require disciplined integration and upkeep |
In petroleum operations, hybrid methods are often practical because they blend physical understanding with data-driven pattern recognition.
🧮 Why Physics Still Matters
Machine learning can find correlations, but petroleum systems are governed by fluid flow, thermodynamics, mechanical limits, reservoir behavior, and control logic. Ignoring these constraints can create recommendations that look plausible in data but make little engineering sense.
A physics-informed workflow may restrict predictions to feasible operating ranges, calculate derived variables such as drawdown, or use nodal analysis to evaluate whether a proposed change can increase rate.
Engineering models are not perfect either. Their inputs and assumptions must be updated as wells and facilities evolve. The strongest workflows use each method to check the other.
🧑💻 The Human Engineer Remains Central
AI can sift signals continuously, but it does not own the production target, understand every field workaround, or accept the consequences of an unsafe decision. Engineers, operators, reliability specialists, and production technologists remain accountable for interpreting alerts.
A useful alert explains what changed, when it changed, which variables contributed, and how confident the system is. It should point users toward the evidence rather than demand blind trust.
Field knowledge is also essential for feedback. An operator may know that a communications outage, weather event, chemical delivery delay, or control modification explains a pattern that the dataset does not yet capture.
🔔 Designing Alerts People Will Use
Too many alerts create alarm fatigue. If a system repeatedly flags harmless conditions, users learn to dismiss it—even when a high-value warning eventually appears.
Good alert design includes severity levels, clear ownership, a recommended first check, and a way to record the outcome. Alerts should be prioritized by more than model score; production impact, safety exposure, environmental consequence, and ease of verification also matter.
- State the affected asset and the abnormal behavior.
- Show the trend or comparison that triggered the alert.
- Separate urgent action from routine review.
- Allow users to classify the alert as confirmed, false, unknown, or expected.
- Use those outcomes to improve the workflow.
🗂️ Building a Useful Failure History
Predictive models learn from the past, which makes failure history valuable. Yet a work order saying “pump issue” may not reveal whether the problem was gas interference, electrical damage, scale, wear, control settings, or a diagnosis later disproved.
Teams benefit from a practical failure taxonomy: a shared set of codes for equipment, failure mode, cause where known, corrective action, and production impact. The taxonomy should be detailed enough to learn from, but simple enough for field teams to use consistently.
High-quality close-out notes can become a long-term engineering asset. They improve future diagnosis even when they are not immediately used in an AI model.
🧭 From Alert to Field Decision
The value of prediction appears only when it changes a decision. A typical workflow moves from detection to validation, then to a proportionate response.
- Verify that the underlying measurements are credible.
- Review recent operating changes, downtime, and maintenance events.
- Compare the well or asset with its expected operating envelope.
- Choose a low-risk diagnostic or adjustment where appropriate.
- Escalate to a field visit, test, intervention, or shutdown if risk justifies it.
- Record what was found and whether the alert was useful.
This process prevents teams from treating every algorithmic output as an emergency while still ensuring that significant risks are not lost in routine noise.
🏭 Production Optimization Is Not Always Maximum Rate
It may seem logical to use analytics to maximize every well’s rate. In reality, the best operating point may depend on water-handling capacity, gas constraints, drawdown limits, sand risk, artificial-lift reliability, emissions considerations, and reservoir-management strategy.
An AI recommendation should therefore be framed within constraints. Raising pump speed may increase liquid rate briefly, but it could worsen gas interference, accelerate wear, or overload downstream treatment capacity.
Optimization means meeting the right objective under real operating limits. Those objectives should be set by the operating team, not inferred casually from a single production metric.
🛰️ Edge Computing and Remote Operations
Some field locations have limited bandwidth or unreliable communications. Edge computing processes selected data near the equipment rather than sending every raw signal to a central platform.
This can support faster local detection, reduce transmission demands, and maintain limited functionality during network interruptions. It does not remove the need for cybersecurity, configuration management, or periodic synchronization with central systems.
Remote operations also change work practices. Better visibility can reduce unnecessary trips, but critical equipment still requires competent inspection and response plans in the field.
🔐 Cybersecurity and Data Governance
Connecting operational technology with analytics systems can increase the attack surface. Production-control networks, remote terminals, and engineering workstations require careful segmentation, access control, patch management, monitoring, and incident planning.
Data governance is equally practical. Teams need to know who owns a tag definition, who can change a model, how versions are approved, and which dataset is considered authoritative.
A highly accurate model is not operationally acceptable if its data path is insecure or its changes cannot be traced. Reliability includes digital reliability.
⚠️ Avoiding Black-Box Recommendations
A black-box model may produce a score without a meaningful explanation. Such models can sometimes be useful, but they create challenges in high-consequence operational settings.
Users need to understand the model’s boundaries: the assets and conditions it was trained on, the inputs it relies upon, and the circumstances in which it may be unreliable. Explainability does not require exposing every mathematical detail, but it does require a defensible reason to investigate.
A sensible practice is to display contributing signals, confidence ranges where available, and comparison with historical normal behavior. This supports engineering judgment rather than replacing it.
🧪 Testing a Model Before Trusting It
Testing should resemble actual deployment. A model trained using future information by accident may appear excellent in development yet fail in real time. This problem, often called data leakage, is common when time-series data is handled carelessly.
Validation should use earlier periods to predict later periods and should include wells, equipment, and conditions not used during training where feasible. Teams should also test how the model behaves with missing data, sensor changes, and operational transitions.
Success is not only an accuracy metric. Useful questions include: How many actionable alerts did it provide? How early were they? What did false alarms cost? What failures did it miss?
📏 Measuring Value Without Inventing Precision
Digital initiatives are sometimes judged by optimistic projected savings rather than verified operating outcomes. A more credible approach tracks specific use cases from alert to action and documents the result.
Depending on the application, teams may assess avoided downtime, reduced repeat failures, faster diagnosis, lower deferral, fewer unnecessary site visits, or improved maintenance planning. Attribution should be cautious because commodity conditions, operating changes, and normal variability also affect results.
Even when a benefit cannot be assigned a precise dollar value, a documented improvement in response quality can justify continued learning—provided the operating burden remains reasonable.
🧱 Common Reasons Digital Oilfield Projects Stall
Many projects struggle not because the algorithm is weak, but because the operating system around it is incomplete. Data may be inaccessible, model ownership unclear, field users excluded, or alerts disconnected from work processes.
Common pitfalls include:
- Starting with a broad “AI platform” instead of a defined production problem
- Building models before establishing data quality and asset context
- Expecting one model to work unchanged across very different wells
- Ignoring the time required to label events and maintain models
- Measuring success only by technical metrics rather than decisions improved
A smaller, well-integrated use case often provides more durable value than an ambitious pilot that never reaches daily operations.
🚀 A Practical Starting Roadmap
Begin with a problem that is frequent enough to learn from, costly enough to matter, and measurable enough to evaluate. Repeated artificial-lift trips, compressor reliability, or unexplained production losses can be reasonable candidates.
Define the decision before selecting the model. Who will act? What information do they need? How quickly must they respond? What action is safe and feasible? Then identify the required measurements, events, and engineering checks.
Deploy the first version as decision support, review outcomes with users, and improve it iteratively. A model that earns trust through transparent, useful alerts is more valuable than a technically sophisticated model that remains outside the workflow.
🎓 Skills Petroleum Professionals Need
Petroleum engineers do not need to become full-time data scientists to contribute effectively. They do need enough data literacy to question inputs, recognize biased comparisons, understand uncertainty, and translate field problems into testable use cases.
Valuable capabilities include production-system analysis, statistics basics, SQL or data-handling familiarity, visualization, control-system awareness, reliability concepts, and clear communication with operations teams.
Data specialists, meanwhile, benefit from learning how wells, facilities, artificial lift, and interventions actually behave. The strongest digital oilfield teams are multidisciplinary by design.
🌱 Environmental and Safety Opportunities
Earlier detection can support environmental and safety performance when it identifies abnormal pressure, leaks, equipment deterioration, unplanned venting conditions, or process instability soon enough for operators to investigate.
These applications require disciplined verification. A sensor anomaly is not proof of a release, and a model should never replace mandated inspections, protective systems, or emergency procedures.
Still, better situational awareness can help teams prioritize inspections and address developing issues before they become larger operational events.
🔮 What the Next Stage May Look Like
Digital oilfields are likely to become more connected across subsurface, wells, facilities, maintenance, and commercial constraints. Digital twins—dynamic representations of an asset or process—may combine physical models and current data to test operating scenarios before changes are made.
Generative AI may also help users search technical records, summarize shift information, or navigate procedures. Its outputs require verification, particularly when they concern engineering calculations, safety-critical actions, or incomplete historical documentation.
The direction is not autonomous production without people. It is better decision support, faster learning, and fewer blind spots across increasingly complex operations.
✅ The Core Principle: Predict Early, Decide Wisely
AI-powered digital oilfields create value when they connect trustworthy data to a clear operational decision. Their purpose is not to produce more alerts or replace engineering expertise; it is to reveal developing problems early enough for people to respond intelligently.
The most effective systems combine quality measurements, physical understanding, transparent analytics, practical workflows, and feedback from the field. When those elements are present, a weak signal can become a planned inspection, a targeted adjustment, or a timely intervention instead of an unexpected loss.
The real advantage is not predicting every failure perfectly—it is giving production teams more time, better evidence, and better choices before a problem grows. 🛢️📈🤝