
A production engineer begins the morning with a familiar question: why did yesterday’s oil rate fall? The answer may be visible in a flowing-pressure trend, a separator test, a workover report, a water-cut calculation, or a reservoir model forecast. Often, those pieces sit in different systems.
On a busy asset, data moves continuously from wells, facilities, laboratories, field crews, and subsurface teams. Turning that stream into a trustworthy operational decision is the practical purpose of a digital oilfield.
Digital oilfields are not simply control rooms with more screens. They are connected workflows that link measurements to engineering interpretation, models, decisions, and field action. When the links are weak, teams spend time reconciling spreadsheets instead of solving production problems.
Understanding the software behind those links helps students see the full production system and helps working professionals ask better questions about data quality, model limits, and automation.
🧭 What a Digital Oilfield Actually Means
A digital oilfield is an operating approach that uses connected data, engineering applications, automation, and collaboration tools to improve decisions across exploration, drilling, production, and facilities. The technology is useful only when it supports a real workflow.
For example, a surveillance workflow may identify a declining well, check recent operating conditions, compare actual behavior with a production forecast, and create an action for a field operator. Software connects the steps; engineering judgment determines whether the action is sensible.
🏗️ The Physical Asset Comes First
Every digital representation refers back to physical equipment: a reservoir, completion, wellbore, tree, flowline, separator, compressor, tank, and export system. A tag in a database is not merely a label; it should correspond to a specific measured point or engineered object.
This sounds obvious, but confusion between similar well names, pressure locations, fluid streams, or units can create misleading analysis. Good digital work begins with a reliable description of the asset and its relationships.
🧱 The Main Layers of an Oilfield Data System
Most connected architectures can be understood as a stack. The exact products vary, but the roles remain recognizable.
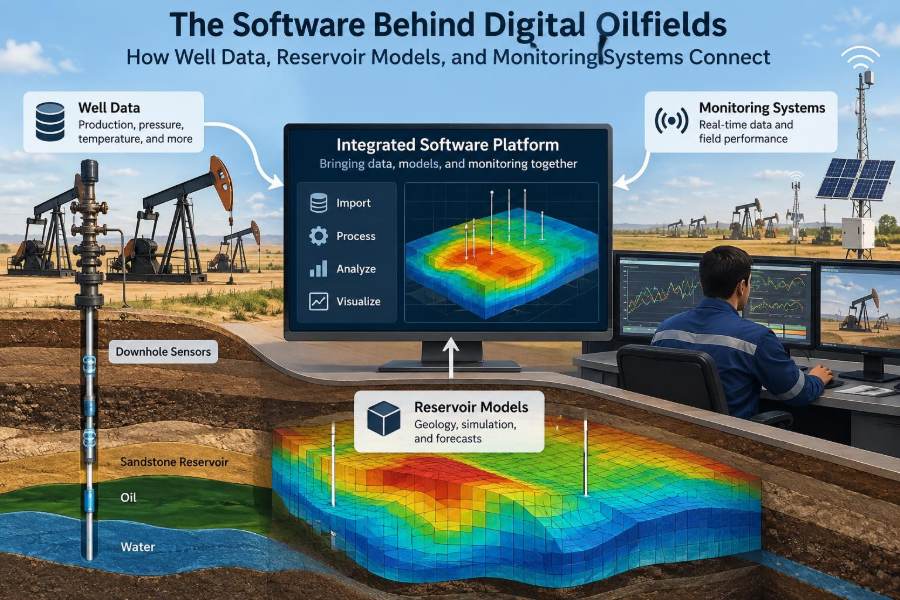
| Layer | Typical role | Example output |
|---|---|---|
| Field and control | Measures and controls equipment | Wellhead pressure trend |
| Data platform | Stores, organizes, and exchanges data | Validated time series |
| Engineering applications | Interprets performance and predicts behavior | Production forecast |
| Workflow and visualization | Supports decisions and actions | Surveillance alert or work list |
The stack should not be treated as a one-way pipeline. Engineers send interpretations and plans back toward operations, while operational results test those interpretations.
📡 Where Well Data Starts
Well data begins with measurements from instruments and human observations. Pressure, temperature, flow rate, valve position, vibration, chemical injection rate, and electrical load may be captured automatically. Test results, fluid samples, maintenance notes, and well interventions are often entered manually.
Each source has a different sampling frequency, reliability, and meaning. A continuously measured tubing-head pressure is not interchangeable with a monthly well test, even if both appear beside one another on a dashboard.
⚙️ SCADA, PLCs, and Remote Operations
SCADA, or supervisory control and data acquisition, gathers data from remote assets and presents it to operators. Programmable logic controllers, remote terminal units, and local control systems execute defined logic close to equipment.
These systems are designed primarily for safe, reliable operation, not for reservoir analysis. An engineering platform may consume a copy of selected operational data, but it should not casually write commands back into control systems. That separation is a major safety and cybersecurity boundary.
⏱️ Time Series Need Context
A time series is a sequence of values indexed by time: for example, one flowing pressure every minute. To interpret it, users need context such as tag name, units, location, status, calibration history, and whether the signal is raw, filtered, or calculated.
A sudden zero may indicate a shut-in well, a communication outage, a failed transmitter, or a configuration change. Without event data and operational context, an automated trend chart can mistake missing information for a physical change.
🧪 Well Tests Create Allocation Anchors
Multiphase production streams commonly mix oil, gas, water, and sometimes solids. A well test helps establish the component rates contributed by an individual well, using a test separator, meter, or another accepted measurement method.
Those results anchor production allocation, the process of estimating each well’s share of commingled production. Tests are snapshots, however. Their relevance declines when choke settings, artificial lift, water cut, or upstream constraints change.
➗ Production Allocation Is an Estimate
When several wells feed a common facility, individual rates may be inferred from periodic tests, well models, multiphase meters, and total facility measurements. Allocation software applies rules and calculations to distribute measured volumes.
This is useful for surveillance, reporting, and commercial accounting, but it carries uncertainty. An allocated well rate should not be treated as direct measurement simply because it has several decimal places. Teams need to preserve the calculation method and quality status.
🗂️ The Role of a Production Data Store
A production data store or historian makes high-volume operational data available over time. It can retain measurements, events, lab values, test results, and calculated variables in a form that analytical and engineering tools can query.
Its value is not just storage capacity. It provides a shared location where users can trace a displayed value to a tag, timestamp, unit, and source system. That traceability is essential when a number influences a production or integrity decision.
🏷️ Names, Units, and Master Data
Master data provides the consistent vocabulary that lets systems recognize that a well, completion interval, meter, and facility belong together. This includes asset hierarchies, identifiers, naming conventions, coordinate references, fluid stream definitions, and units.
A common failure occurs when one application calls a well “A-12,” another uses “A12,” and a third assigns the same label to a surface slot rather than a borehole. Integration cannot reliably repair unclear engineering definitions.
🔌 APIs and Data Connectors
An application programming interface, or API, allows software applications to exchange data through defined requests and responses. Connectors, message queues, file transfers, and database interfaces can serve similar purposes in older or specialized environments.
The technical connection is only one part of integration. A useful interface must also define what each field means, which system owns it, how often it updates, and what happens when a value is unavailable or corrected.
🧾 Data Lineage Builds Confidence
Data lineage records where a value came from and how it changed. A displayed oil rate might originate from a raw meter reading, pass through calibration adjustments and allocation logic, then feed a daily volume report.
Lineage makes disagreement productive. Instead of debating whose spreadsheet is correct, users can inspect the source, transformation, assumptions, and timestamp. It is particularly valuable when model results inform spending, reserves work, or operating limits.
🧹 Quality Control Before Analysis
Data quality checks screen for impossible values, unit mismatches, duplicate records, stale signals, missing periods, and implausible rate changes. Automated rules can flag problems, but they cannot always decide whether an unusual value is a sensor fault or a genuine operating event.
A practical workflow retains both the raw record and a quality-controlled version. Silent replacement of data may make a dashboard look cleaner while removing evidence needed to diagnose an instrument or process issue.
🪨 Static Reservoir Models Describe the Rock
A static reservoir model represents the subsurface geometry and properties of a reservoir. It commonly integrates seismic interpretation, well tops, faults, structural surfaces, facies, porosity, permeability, saturation, and contacts into a three-dimensional grid.
The model does not reveal the reservoir with perfect certainty. Between wells, property distributions are inferred from available evidence. Multiple realizations may be needed where geological uncertainty materially affects development choices.
💧 Dynamic Simulation Describes Fluid Movement
A dynamic reservoir simulation model uses the static framework along with fluid properties, relative permeability, pressure-volume-temperature behavior, wells, and operating controls to calculate how fluids may move over time.
It can test questions such as whether water injection support is reaching a producer, how a shut-in changes pressure depletion, or whether a new well could accelerate recovery. A simulator is a conditional prediction tool, not a crystal ball.
🔄 History Matching Connects Models to Reality
History matching adjusts uncertain model inputs so simulated behavior reasonably reproduces relevant historical observations, such as pressure, oil rate, water rate, gas-oil ratio, and breakthrough timing. The aim is not to force an exact match to every noisy data point.
A model can match history for the wrong physical reason if parameters are changed without geological and engineering discipline. Teams should evaluate whether the chosen explanation is plausible, not just whether the error curve looks smaller.
🛢️ Well Models Bridge Reservoir and Surface
A well model represents pressure losses and fluid behavior from reservoir to surface. It may include inflow performance, tubing hydraulics, choke behavior, artificial lift, flowline conditions, and separator pressure.
This bridge matters because a production decline is not always a reservoir decline. A restricted choke, rising backpressure, scale in tubing, gas-lift performance change, or unstable flowline can alter rates even when reservoir deliverability remains similar.
📉 Nodal Analysis Makes Constraints Visible
Nodal analysis compares inflow from the reservoir with outflow through the completion and surface system at a selected point, or node. Where the inflow and outflow relationships meet, the model estimates an operating rate and pressure condition.
It gives engineers a structured way to test changes. In a hypothetical case, lowering separator pressure may improve one well’s rate, but the downstream compressor or pipeline may become the new bottleneck. Optimization must consider the network, not an isolated well.
🕸️ Surface Network Models Link Wells and Facilities
Surface network models connect wells, flowlines, manifolds, separators, compressors, pumps, and export constraints. They estimate how pressure and flow interact across the system as operating conditions change.
These models are especially useful when wells compete for limited processing capacity or share a constrained line. Their reliability depends on current equipment configuration, fluid characterization, and calibration against observed pressures and rates.
🧠 Digital Twins Need a Precise Definition
The term digital twin is often used broadly. In a useful engineering sense, it is a digital representation of a physical asset that is connected to relevant data and maintained well enough to support a specific decision or operating workflow.
A dashboard alone is not necessarily a twin, and neither is an old simulation file. The practical question is: what physical behavior does the representation capture, how is it updated, and what decision can it improve?
🚨 Surveillance Turns Data Into Questions
Production surveillance looks for deviations that warrant investigation: unexpected decline, rising water cut, unstable pressure, poor lift efficiency, compressor behavior, injection imbalance, or a mismatch between actual and forecast performance.
Good alerts prioritize context over volume. A well may be below target because it is intentionally choked back for facility limits; that is not the same as an unexplained loss. Alert logic should incorporate operating states, planned activities, and data quality flags.
🤖 Analytics and Machine Learning Have Boundaries
Analytics can detect patterns across large data sets, classify operating states, estimate missing values, and identify combinations of conditions associated with problems. Machine-learning methods can be valuable where relationships are complex and enough representative, quality-controlled data exists.
They are less reliable outside the conditions represented in training data. A model may confuse a new completion design, sensor replacement, or changed operating policy with a physical pattern. Physics-based models and domain review remain important safeguards.
👥 Collaboration Is an Engineering Requirement
Reservoir engineers, production engineers, flow assurance specialists, operators, maintenance teams, data specialists, and commercial staff view the asset from different angles. Connected software helps only when it supports a shared decision process rather than creating another isolated screen.
A useful morning review might combine exceptions from surveillance, recent field actions, facility constraints, model forecasts, and a clear owner for each follow-up. The outcome is not a prettier dashboard; it is a timely, accountable action.
🔐 Cybersecurity and Access Control Matter
Connecting operational and business systems expands the paths through which data and commands could be exposed. Access should follow the principle of least privilege: people and applications receive only the permissions needed for their role.
Segmentation, authentication, patching practices, backups, monitoring, and tested recovery procedures all matter. Because operational technology can affect physical equipment, changes to interfaces and remote access need stronger discipline than a typical office application update.
🧰 A Practical Integration Workflow
Successful projects usually start with a defined decision, such as reducing the time required to identify constrained production. Then the team works backward to identify needed data, users, rules, model inputs, and field actions.
- Define the decision and the accountable users.
- Map source data, ownership, frequency, units, and quality concerns.
- Build a small usable workflow rather than a broad untested platform.
- Validate outputs against field knowledge and independent calculations.
- Measure whether the workflow changes response time, uncertainty, or outcomes.
- Improve governance before expanding to more assets.
⚠️ Common Digital Oilfield Failure Modes
The most damaging problems are often organizational rather than technical. A platform can contain excellent models and still fail if users do not trust its data or do not know who acts on an alert.
- Dashboard overload: many indicators, no clear decision path.
- Spreadsheet shadow systems: local calculations replace governed shared data.
- Model drift: configurations and assumptions no longer reflect the asset.
- Automation without review: false signals consume attention or hide uncertainty.
- Unclear ownership: data issues persist because no one owns correction.
🎓 Skills That Make Engineers More Effective
Petroleum engineers do not need to become full-time software developers to work effectively in digital environments. They do need enough data literacy to question units, timestamps, source systems, uncertainty, and the assumptions behind a calculated value.
Useful skills include production fundamentals, reservoir and well modeling, basic statistics, visualization, relational data concepts, scripting or query tools, and clear communication with operations. Most importantly, learn to translate a field question into a testable data and engineering workflow.
🧪 A Simple End-to-End Example
Consider a hypothetical producer whose allocated oil rate falls while water production rises. Surveillance flags the change, but the engineer first checks data quality, recent well tests, choke position, downtime records, and facility pressure.
If those checks support a real change, the team compares flowing pressure with the well model and reviews reservoir pressure and nearby injection behavior. The result may be a diagnostic action, such as a pressure survey or scale investigation, rather than an immediate optimization command. Each software layer narrows uncertainty; none replaces the field evidence.
📏 Measuring Value Without Overselling It
Value should be measured against the workflow’s original purpose. Relevant indicators may include faster validation of production losses, fewer manual reconciliations, improved forecast quality, reduced avoidable downtime, or clearer auditability of reported volumes.
Not every benefit is easily converted into a single number, and results depend on asset maturity, data availability, operating discipline, and the quality of implementation. A modest tool that is trusted and routinely used can outperform an ambitious platform that has no operational owner.
🧩 The Core Principle: Connect Decisions, Not Just Databases
The central architecture of a digital oilfield is a feedback loop: physical asset, measurement, validated data, engineering interpretation, decision, field action, and new measurement. Reservoir models, well models, network models, and monitoring systems each describe a different part of that loop.
The strongest systems preserve context and uncertainty at every handoff. They make it possible to ask where a number originated, what assumptions shaped a forecast, who owns the next action, and whether the physical response confirmed the decision.
Digital oilfields work best when software strengthens the connection between reliable evidence, engineering judgment, and disciplined field action—not when it merely adds another layer of screens. 🛢️📊⚙️