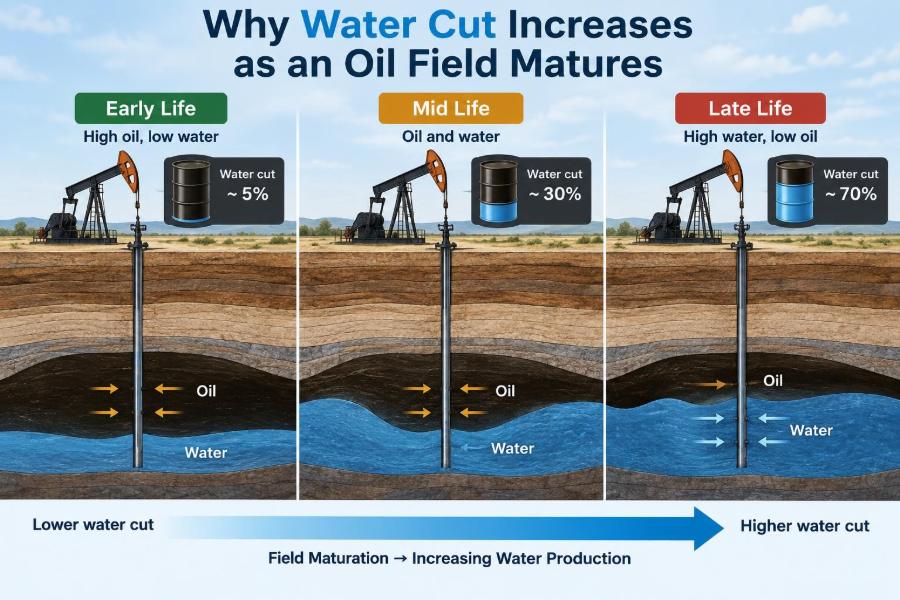

A production engineer reviews the morning report and sees a familiar pattern: oil rate is lower, produced-water volume is higher, and the separator is working harder than it did a few years ago. The well may still be commercially valuable, but the fluid coming to surface has changed.
For students, water cut can seem like a simple percentage on a production chart. For operating teams, it affects pumping power, chemical use, corrosion control, water-treatment capacity, disposal options, emissions, and the decision to intervene in a well.
Rising water cut is often a normal consequence of producing a reservoir over time. It is not automatically evidence of poor operations or a failed well. Yet the way water arrives matters greatly: gradual water encroachment calls for different decisions than a sudden channel behind casing.
Understanding the mechanisms behind water production helps engineers distinguish natural reservoir behavior from avoidable problems—and identify when an extra barrel of oil is no longer worth the water handled alongside it.
💧 Water Cut: The Basic Definition
Water cut is the fraction of the produced liquid stream that is water. It is usually reported as a percentage:
Water cut = water volume / (oil volume + water volume) × 100
A well producing 100 barrels of water and 100 barrels of oil per day has a 50% water cut. Gas is not included in this liquid-based calculation. Water cut is different from water–oil ratio, which expresses water volume relative to oil volume and can become very large at high water cuts.
🧪 Produced Water Is Not Always the Same Water
Produced water may be formation water, the saline water naturally present in reservoir pores, or injected water used for pressure maintenance and improved sweep. It can also include water from an aquifer connected to the reservoir.
In some cases, the source is not the reservoir at all. Water may enter through a failed casing connection, a leaking completion component, or communication with another water-bearing interval. Source identification therefore comes before choosing a treatment.
🪨 Reservoir Pores Start with More Than Oil
Oil reservoirs are porous rock volumes, not underground lakes. Their tiny connected pores commonly contain oil, water, and sometimes gas. The proportions of these fluids within the pore space are called saturations.
At the beginning of production, oil may have sufficient mobility to dominate the flow into a well. Water may be present but relatively immobile, held in smaller pores or on rock surfaces by capillary forces. Production changes these fluid distributions.
⚖️ Pressure Depletion Changes the Flow Balance
When fluids are withdrawn, average reservoir pressure declines unless natural or injected support replaces it. Lower pressure changes the forces moving oil and water toward the wellbore.
As oil saturation falls in parts of the reservoir, oil relative permeability—the rock’s effective ability to transmit oil—usually declines. If water saturation rises, water relative permeability tends to increase. The produced stream can therefore become progressively wetter even when the reservoir still contains substantial oil.
🧭 Relative Permeability Explains the Shift
Two fluids flowing through the same rock compete for pore pathways. Relative permeability describes this shared-flow behavior rather than the rock’s absolute permeability measured with only one fluid.
Imagine a corridor becoming crowded. As more people occupy it, any one person has fewer direct routes. Similarly, increasing water saturation opens connected water pathways while reducing the pathways available to oil. This is one reason water-cut growth can accelerate late in field life.
🌊 Natural Aquifers Push Water Upward
Many reservoirs are connected to an aquifer, a water-bearing rock body capable of supplying water as pressure declines. This water influx can be valuable because it supports reservoir pressure and can help sustain oil production.
The trade-off is water encroachment. As the oil-water contact moves or tilts toward producing intervals, more water becomes available to flow into wells. The rate and pattern depend on aquifer strength, reservoir geometry, permeability distribution, drawdown, and production history.
⬇️ Water Coning Near the Wellbore
In a reservoir with water below the oil zone, pressure drawdown around a producing well can pull the oil-water interface upward locally. This upward distortion is called water coning.
If the cone reaches the completion interval, water production rises sharply. A well completed too close to the contact, or produced at an aggressively high rate, is more susceptible. Reducing drawdown may stabilize the cone in some cases, but it cannot always reverse the water already established near the well.
🧱 Cresting Can Occur in Horizontal Wells
Horizontal wells expose a long section of reservoir and can deliver high oil rates with lower local drawdown than a vertical well. However, water may rise toward the wellbore at multiple points along the lateral; this behavior is often described as water cresting.
Uneven permeability, variations in completion quality, and changes in trajectory relative to the fluid contact can make one section water out before the rest. This is why distributed inflow data can be especially useful in horizontal-well diagnosis.
🚿 Waterflooding Deliberately Introduces Water
Water injection is widely used to maintain pressure and displace oil toward producers. A rising field water cut during waterflooding is not inherently bad. It may reflect that injected water is moving through the reservoir and providing sweep.
The engineering question is whether water is contacting oil across a broad volume or bypassing it through a small number of fast paths. Productive displacement tends to yield oil over time; early, concentrated breakthrough may signal poor conformance.
🛤️ High-Permeability Streaks Create Fast Paths
Reservoirs are rarely uniform. Thin high-permeability layers, natural fractures, channels, or faults can transmit water much faster than surrounding rock. Injected or aquifer water preferentially follows the least-resistant routes.
This can cause an injector and producer to communicate rapidly while lower-permeability, oil-bearing rock remains poorly swept. The producer sees more water, but a large volume of oil may still be stranded away from the fast path.
🧩 Geological Heterogeneity Controls Sweep
Sweep efficiency describes how effectively a displacement process contacts the reservoir volume and mobilizes oil. It is shaped by layering, facies changes, permeability contrasts, barriers, fractures, and fluid mobility.
Even a well-designed flood can leave bypassed oil if water fingers around it. Water cut alone cannot reveal where the remaining oil is. It must be interpreted alongside geological models, pressure behavior, injection data, and well surveillance.
🫧 Viscosity Contrast Encourages Fingering
Water is often less viscous than oil. When a less-viscous fluid displaces a more-viscous one, the advancing front can become unstable and form narrow fingers rather than a smooth, piston-like front.
These fingers reach producers early and raise water cut before much of the oil has been displaced. Mobility-control methods, including certain polymer applications, may improve sweep in suitable reservoirs, but they require careful screening for injectivity, salinity, temperature, and economics.
🔩 Completion Failures Can Imitate Reservoir Watering-Out
Not every water increase comes from reservoir displacement. A tubing leak, damaged packer, failed cement, corroded casing, or unintended flow behind pipe can create a direct route from a water zone to the producing interval.
This distinction is critical. Reducing production rate may help a cone but will not repair a mechanical leak. A sudden, unusual water increase—especially one inconsistent with nearby wells or reservoir expectations—deserves a well-integrity investigation.
🧱 Cement and Zonal Isolation Matter
Primary cement is intended to support casing and isolate formations. If cement does not effectively isolate a water-bearing zone, pressure differences can drive water behind casing and into perforated intervals.
Remedial cementing, mechanical isolation, or selective recompletion can sometimes address this problem. Success depends on correctly locating the flow path; treating the wrong interval can add cost without reducing water production.
📈 Breakthrough Is a Pattern, Not Just a Number
There is no universal water-cut percentage that defines water breakthrough. A field already producing water may show breakthrough as a change in trend, while a previously dry oil producer may show it as a sudden first appearance of water.
Engineers look at the shape of the history: water rate, oil rate, pressure, choke changes, injection response, and offset-well behavior. A gradual rise may fit regional encroachment. An abrupt step change can indicate a channel, fracture connection, or completion issue.
📊 Oil Rate and Water Rate Must Be Read Together
Water cut can rise even while oil rate holds steady if water rate increases. It can also rise because oil rate falls faster than water rate. Looking only at a percentage can hide these very different operational situations.
| Observed trend | Possible interpretation |
|---|---|
| Oil declines; water remains similar | Depletion, declining oil mobility, or changing lift performance |
| Water rises sharply; oil changes little | Water breakthrough, coning, or new unwanted water entry |
| Water and oil both rise after injection change | Improved pressure support or changing flood response |
| Water rises abruptly after workover | Completion, isolation, or flow-path issue requiring diagnosis |
These are diagnostic clues, not proof. Reservoir and well data are needed to test each explanation.
🧰 Surveillance Turns a Trend into a Diagnosis
Useful surveillance combines surface measurements with downhole evidence. Routine allocation tests establish oil, water, and gas contributions, while pressure surveys help track depletion and communication.
- Production logging can identify which intervals contribute water or oil.
- Temperature and noise logs can indicate behind-casing flow under suitable conditions.
- Tracer programs can help investigate injector-producer communication.
- Water chemistry may distinguish injected water, formation water, or another source.
- Time-lapse saturation monitoring can support field-scale interpretation where available.
No single measurement is decisive in every well. The strongest diagnosis usually comes from several consistent pieces of evidence.
🧂 Water Chemistry Can Provide Clues
Produced-water salinity and ionic composition can differ between aquifer water, formation brine, and injected water. Comparing samples over time may reveal mixing or a change in the dominant source.
Sampling needs discipline. Contamination, variable separator conditions, and incomplete phase separation can distort results. Chemistry is best treated as corroborating evidence, not a standalone verdict on the water source.
⚙️ Artificial Lift Feels the Consequences
As water cut rises, the well may need to lift more total liquid for each barrel of oil. This raises hydraulic loading and can alter the suitable operating range for electric submersible pumps, rod pumps, gas lift, or other lift systems.
Water also changes fluid properties and flow behavior. Free gas, scale, solids, emulsion tendency, and changing intake pressure complicate lift design. A pump selected for early-life oil-rich production may be inefficient or unreliable later in the well’s life.
🏭 Surface Facilities Eventually Become the Constraint
Produced water must be separated, treated, stored, reinjected, discharged where permitted, or otherwise managed. A mature field can become water-handling constrained even when wells still contain recoverable oil.
Separators require residence time to separate phases. Water-treatment systems must manage oil carryover, suspended solids, microorganisms, dissolved minerals, and compatibility with the disposal or injection destination. Bottlenecks often shift from the reservoir to the facilities.
🧪 Scale, Corrosion, and Bacteria Raise Operating Risk
Water provides the medium for many integrity problems. Mixing incompatible waters can precipitate mineral scale, while dissolved gases and salts can contribute to corrosion. Certain microbial populations may worsen corrosion or cause plugging under favorable conditions.
Management may include chemical inhibition, oxygen control, filtration, material selection, cleaning, and monitoring. These measures reduce risk, but they should be based on representative fluid data and operating conditions rather than applied as a generic recipe.
🌍 Produced-Water Management Has Environmental Stakes
Produced water is often saline and may contain dispersed hydrocarbons, dissolved constituents, treatment chemicals, and naturally occurring materials that require controlled handling. The appropriate route depends on fluid characteristics, local infrastructure, and applicable requirements.
Reinjection can support disposal or reservoir management, but it requires compatible water quality and adequate injectivity. Spills, leaks, and poorly managed storage create environmental and operational liabilities, making containment and integrity management central to mature-field operations.
💰 The Economic Limit Moves with Water Volume
A well’s value depends on net oil revenue and the full cost of producing, lifting, separating, treating, transporting, and disposing of fluids. As water cut grows, operating cost per barrel of oil commonly rises.
That does not mean a high-water-cut well must be shut in. If water handling is available and oil production remains sufficient, continued operation may be justified. The economic limit is field-specific and can change with facility capacity, water-disposal cost, production performance, and development strategy.
🧠 Rate Reduction Is Helpful Only in the Right Case
Reducing drawdown can lessen coning or delay further water encroachment in some wells. It may also improve pump operation or keep total liquids within facility limits. However, it reduces oil production immediately and may not address a channel or behind-casing leak.
The right question is not “Should we choke back every wet well?” It is “What mechanism is producing the water, and what response changes that mechanism favorably?”
🛠️ Selective Shutoff Can Protect Oil-Producing Intervals
If water enters through a limited, identifiable interval, engineers may use mechanical plugs, packers, cement squeezes, gels, resins, or selective recompletion strategies. The objective is to restrict water while preserving access to oil-bearing rock.
Results vary because reservoirs are complex and isolation materials may enter unintended pathways. A treatment is more likely to succeed when the water source, interval geometry, pressure relationships, and remaining oil potential are well established beforehand.
🧴 Conformance Control Seeks Better Flood Distribution
For injection-related water problems, conformance control aims to redirect injected water away from thief zones and toward poorly swept rock. Possible approaches include modifying injection patterns, adjusting rates, selectively isolating high-injectivity intervals, or applying suitable chemical systems.
These projects require a field-scale view. Restricting one fast path can improve sweep, but it can also raise injection pressure or shift flow elsewhere. Reservoir simulation and staged field trials help manage this uncertainty.
🧭 Pattern Management Connects Injectors and Producers
In a waterflood, injector rates should not be managed independently of producer response. Voidage replacement, pressure distribution, injection allocation, and breakthrough timing all influence whether water is doing useful displacement work.
Regular pattern review can identify over-supported areas, under-injected zones, and possible short circuits. The goal is not simply to minimize water production; it is to maximize economically recoverable oil while operating the water system safely and within capacity.
🧮 Forecasting Requires More Than Extrapolating Water Cut
A smooth historical water-cut trend can be tempting to extend into the future. Yet workovers, injector changes, new wells, facility constraints, and evolving lift performance can alter the trajectory.
Better forecasts combine production history with reservoir understanding and operational scenarios. Uncertainty should be explicit: a forecast of gradual aquifer encroachment is less reliable if the well also has unresolved integrity concerns or nearby injection changes.
🚫 Common Interpretation Mistakes
Several shortcuts repeatedly lead to poor decisions:
- Assuming all late-life water is inevitable reservoir water.
- Using water cut without examining absolute oil and water rates.
- Calling every early breakthrough a failed waterflood.
- Treating a well before identifying the source and entry interval.
- Ignoring facility capacity until water constrains oil production.
- Judging an intervention only by lower water rate rather than incremental oil, cost, and durability.
A disciplined diagnosis can prevent unnecessary shut-ins and avoid expensive treatments aimed at the wrong problem.
🔍 A Practical Diagnostic Sequence
When a well becomes wetter, a structured workflow is useful. First verify the measurement: allocation errors, separator performance, and test quality can create misleading trends.
- Review oil, water, gas, pressure, choke, lift, and workover history.
- Compare the well with nearby producers and relevant injectors.
- Assess plausible reservoir mechanisms from contacts, geology, and flood history.
- Check for integrity or completion-related explanations.
- Acquire targeted surveillance only when it can change the decision.
- Compare options against expected oil recovery, water reduction, risk, cost, and facility impact.
This sequence does not eliminate uncertainty, but it makes assumptions visible and intervention choices more defensible.
🎓 What a Mature Field Is Really Telling You
Increasing water cut is the surface expression of changing saturation, pressure, mobility, and flow paths underground. It often signals that the easy-to-produce oil has declined and that the remaining oil is increasingly governed by reservoir architecture and fluid displacement.
For operators, high water cut turns petroleum engineering into an integrated problem: reservoir management, production engineering, well integrity, chemistry, facilities, economics, and environmental stewardship must work together.
✅ The Core Takeaway
Water cut usually rises as an oil field matures because water becomes more mobile and gains better access to producing wells as pressure declines, aquifers encroach, or injected water advances. Reservoir heterogeneity and well conditions determine whether that rise is gradual, early, uneven, or abrupt.
The most effective response is not a universal water-control product or a single production target. It is a diagnosis that separates normal displacement behavior from coning, channeling, and mechanical water entry—then chooses an action that protects oil value while managing the water responsibly.
A rising water cut is not merely a late-life nuisance; it is evidence about how fluids are moving through the reservoir and well, and that evidence should guide every next decision. 🛢️💧⚙️