
A production engineer sees a familiar pattern: the well is still open, the facilities are available, yet the daily oil rate has slipped. The immediate question is often, “What changed?”
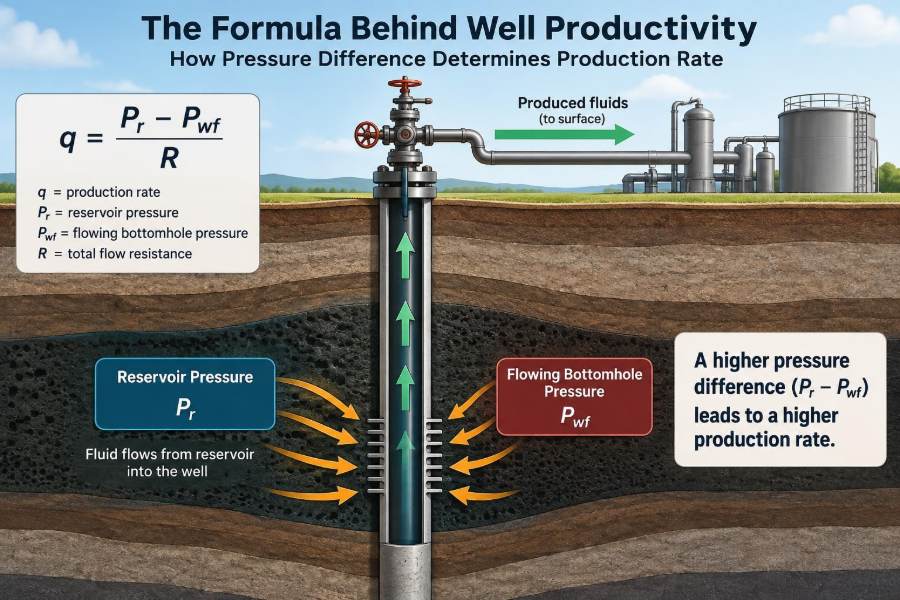
The answer may begin with a pressure measurement. A well produces because reservoir fluids are at a higher pressure than the flowing pressure at the wellbore. That difference is the force that moves oil, gas, and water through rock and into the completion.
It sounds simple, but translating a pressure difference into a reliable production forecast requires more than subtracting two numbers. Rock permeability, fluid viscosity, skin damage, multiphase flow, completion design, and artificial lift can all reshape the result.
Understanding the formula behind well productivity helps students connect reservoir engineering to daily operations. It also helps working professionals distinguish a true reservoir-performance problem from a restriction created near the well or at the surface.
🧭 Production Starts With a Driving Force
Fluid does not move from the reservoir to the well just because a well has been drilled. It moves when there is a pressure gradient: pressure decreases from the drainage area toward the wellbore.
Think of a raised water tank connected to a lower outlet. The elevation difference supplies the driving force. In a reservoir, pressure plays that role. The larger the useful pressure difference, the stronger the tendency for fluids to flow—provided the rock and well completion allow it.
📐 The Core Productivity Equation
For a simple, single-phase liquid system operating under stabilized conditions, the relationship is often written as:
q = J (p̄r − pwf)Here, q is production rate, J is the productivity index, p̄r is average reservoir pressure, and pwf is flowing bottomhole pressure. The term (p̄r − pwf) is the drawdown.
This expression is a practical model, not a universal law for every well condition. Its clean linear form is most appropriate when a slightly compressible liquid, commonly oil above bubble point, flows in a stable manner.
🔽 Drawdown: The Pressure Difference That Matters
Drawdown is the difference between average reservoir pressure and flowing bottomhole pressure. If the reservoir pressure is 3,000 psi and flowing bottomhole pressure is 2,400 psi, drawdown is 600 psi.
Increasing drawdown normally increases rate because it creates a steeper pressure decline toward the well. But “more drawdown” is not automatically the best operating decision. Excessive drawdown can encourage gas liberation, water or gas coning, fines migration, sanding, and unstable flow.
🏷️ What the Productivity Index Represents
The productivity index, or PI, describes how readily a well delivers liquid for each unit of drawdown. Its common units are barrels of liquid per day per psi, although metric units are also widely used.
A PI of 2 bbl/d/psi means that, within the linear-flow approximation, each additional psi of drawdown corresponds to about 2 more barrels per day. PI combines reservoir quality, fluid mobility, drainage geometry, and near-wellbore condition into one operationally useful number.
🧮 A Simple Hypothetical Calculation
Consider a hypothetical oil well with an average reservoir pressure of 2,800 psi, a flowing bottomhole pressure of 2,300 psi, and a PI of 1.5 bbl/d/psi. Its drawdown is 500 psi.
q = 1.5 × (2,800 − 2,300) = 750 bbl/dIf flowing bottomhole pressure rose to 2,500 psi while PI stayed unchanged, the calculated rate would fall to 450 bbl/d. The example isolates pressure difference; real wells may change PI as operating conditions change.
🪨 Permeability Controls the Rock’s Ability to Flow
Permeability measures how easily a rock allows fluids to pass through connected pore spaces. High permeability generally supports a higher PI because less pressure loss is needed to move a given volume toward the well.
Porosity alone is not enough. A rock can hold substantial fluid yet have poorly connected pores, producing low permeability and low deliverability. Layering, natural fractures, and directional permeability can also make flow behavior different from what a single core measurement suggests.
🧴 Fluid Viscosity Creates Resistance
Viscosity is a fluid’s internal resistance to flow. Heavy oil has a higher viscosity than light oil, so it generally requires more drawdown to achieve the same rate through comparable rock.
Temperature, pressure, and dissolved gas influence oil viscosity. In thermal operations, reducing viscosity can be as important as changing pressure drawdown. That is why the same well geometry can perform very differently for different fluids.
💧 Relative Permeability Changes in Multiphase Flow
Reservoir pores often contain oil, water, and gas simultaneously. Each phase competes for the available flow pathways, so its effective ability to move is lower than it would be if it occupied the rock alone.
This is described by relative permeability. Rising water saturation may reduce oil relative permeability, while free gas can reduce oil mobility and alter pressure behavior. A simple liquid PI then becomes less reliable as a complete description of the well.
🫧 Why Bubble Point Changes the Equation
When pressure near the well falls below the bubble-point pressure, gas comes out of solution. The resulting flow is no longer a single liquid phase, and the straight-line relation between rate and drawdown may bend.
For solution-gas-drive oil wells, engineers commonly use an inflow performance relationship, or IPR, that accounts for two-phase behavior. The Vogel relationship is a widely taught approximation for wells producing below bubble point, but it relies on assumptions and should be checked against suitable field data.
📈 The Inflow Performance Relationship
An IPR curve plots production rate against flowing bottomhole pressure. At reservoir pressure, drawdown is zero and the rate is zero. As flowing bottomhole pressure falls, the predicted inflow rate rises.
The curve is linear for an idealized undersaturated oil well with constant PI. For saturated oil or gas wells, it is typically curved. IPR gives engineers a visual way to ask how much additional inflow is realistically available at a lower bottomhole pressure.
📉 Absolute Open Flow Is a Limit, Not a Target
On an IPR curve, the rate predicted at a flowing bottomhole pressure of zero is sometimes called the absolute open flow conceptually. It represents a mathematical endpoint rather than a normal operating condition.
A real well cannot simply be operated at zero bottomhole pressure. Tubing, choke, separator pressure, multiphase flow, equipment limits, formation stability, and economics all constrain the usable operating range.
🧱 Skin Factor Adds Near-Wellbore Pressure Loss
Skin is a dimensionless term describing extra pressure drop near the wellbore compared with ideal radial flow through undamaged formation. Positive skin restricts flow; negative skin indicates improved flow capacity, often after effective stimulation.
Formation damage from drilling fluids, scale, fines, emulsions, perforation damage, or completion debris can produce positive skin. Because this resistance sits close to the well, it can sharply reduce rate even when the broader reservoir remains capable of supplying fluid.
🧪 Stimulation Can Improve PI—With Boundaries
Acidizing may dissolve or bypass certain damage mechanisms, especially in appropriate carbonate or sandstone applications. Hydraulic fracturing can create a high-conductivity pathway that reduces the distance fluids must travel through low-permeability rock.
Neither treatment is a generic cure. Candidate selection depends on rock type, stress, fluid compatibility, damage diagnosis, completion configuration, containment risk, and expected economics. A pressure-related rate decline caused by high backpressure will not be fixed merely by treating the formation.
🔩 Completion Design Sets an Additional Constraint
Perforations, screens, gravel packs, liners, and open-hole intervals determine how reservoir fluid enters the well. Limited perforation density, partial penetration, poor cleanup, or plugged screens can add substantial inflow resistance.
This means a low observed PI does not always mean low reservoir permeability. The measurement may reflect a completion bottleneck. Separating formation, completion, and tubing pressure losses is central to sound diagnosis.
🕳️ Wellbore Storage Can Mislead Early Tests
Immediately after changing choke settings or shutting in a well, the first fluid response may come mainly from expansion or unloading inside the wellbore. This is called wellbore storage.
During this period, pressure and rate data may not represent the reservoir’s true inflow behavior. Interpreting a productivity test before the transient response has settled can lead to an incorrect PI or an incorrect conclusion about damage.
⏱️ Stabilized Flow Versus Transient Flow
Under stabilized or pseudo-steady-state flow, the pressure distribution has developed enough that production analysis can relate rate to average reservoir pressure in a practical way. Many textbook PI calculations assume this condition.
During transient flow, the pressure disturbance is still expanding into the reservoir. Transient well testing remains valuable, but its analysis uses time-dependent models rather than treating one pressure and rate pair as a permanent productivity measure.
🛢️ Tubing Pressure Is Not Bottomhole Pressure
Surface tubing pressure is easy to observe, but it is not the same as flowing bottomhole pressure. Between the reservoir and surface, pressure changes because of hydrostatic head, friction, acceleration, and gas-liquid slip.
For a flowing well, engineers estimate or measure bottomhole pressure using downhole gauges, pressure surveys, or calibrated multiphase-flow correlations. Treating wellhead pressure as bottomhole pressure without correction can distort the apparent drawdown dramatically.
🚰 Surface Backpressure Reaches the Reservoir
A restrictive choke, high separator pressure, undersized flowline, scale buildup, or downstream facility constraint raises pressure upstream. That increased backpressure can raise flowing bottomhole pressure and reduce drawdown.
This is one of the most actionable production insights: a lower rate does not always call for reservoir intervention. In some cases, removing a surface restriction restores drawdown without changing the reservoir itself.
⚖️ The Operating Point Joins Inflow and Outflow
Production occurs where the well’s inflow capacity matches the pressure required to lift fluids through tubing and surface equipment. The outflow requirement is represented by vertical lift performance, or VLP.
Plotting IPR and VLP together produces a nodal-analysis view of the operating point. Changing a choke, tubing size, gas-lift rate, separator pressure, or pump setting shifts the outflow curve; stimulation or reservoir depletion changes the inflow side.
🏗️ Artificial Lift Changes Pressure, Not Reservoir Energy
Artificial-lift systems such as rod pumps, electrical submersible pumps, gas lift, and progressive cavity pumps help lower flowing bottomhole pressure or manage fluid lifting. In effect, they can create more usable drawdown at the sandface.
They do not create reservoir fluid or permanently restore reservoir pressure. Their benefit depends on whether the reservoir can deliver additional fluid and whether the completion and surface system can handle the changed rate and fluid mix.
⚠️ Too Much Drawdown Has Consequences
Lowering bottomhole pressure aggressively can improve short-term rate while creating longer-term problems. The right drawdown is a reservoir-management decision, not simply the maximum pressure difference available.
- High drawdown near a water contact can promote water coning or cresting.
- High drawdown near a gas cap can promote gas coning and reduce oil-handling efficiency.
- Weak or unconsolidated formations may produce sand when stresses change around the wellbore.
- Large pressure reductions can increase scale, gas breakout, emulsions, and multiphase-flow instability.
🌊 Water Cut Can Hide a Changing Oil PI
A well can maintain or increase total liquid rate while producing less oil. If water cut rises, a liquid-based PI may look acceptable even though oil relative permeability and oil rate are deteriorating.
Production surveillance should therefore separate oil, water, gas, and total liquid rates. Looking only at gross fluid rate may conceal breakthrough, coning, channeling, or changing inflow allocation between reservoir layers.
💨 Gas Wells Need Deliverability Models
Gas is highly compressible, and its viscosity and compressibility vary appreciably with pressure. Gas-well rate does not usually follow the simple linear oil PI equation across a broad pressure range.
Gas deliverability analysis commonly uses pressure-squared or pseudopressure methods, depending on conditions and required accuracy. Turbulence near the wellbore can add a non-Darcy pressure loss that becomes especially relevant at high rates.
🧾 Measuring the Inputs Correctly
A formula is only as useful as its inputs. Average reservoir pressure may come from pressure surveys, buildup interpretation, material-balance work, or calibrated reservoir models; each carries uncertainty and may represent different drainage volumes.
Useful field measurements include stabilized rates, flowing pressures, fluid properties, water cut, gas-oil ratio, choke position, separator pressure, and equipment status. A test point should record operating context, not merely a rate and one pressure value.
🔍 Interpreting a Falling Rate Systematically
When production declines, start by identifying where the additional pressure loss appears. Compare recent operating conditions with prior stable periods before assuming depletion or formation damage.
- Verify rate allocation and meter quality.
- Check wellhead, flowline, choke, and separator pressures for changed backpressure.
- Estimate or measure flowing bottomhole pressure.
- Review water cut, gas-oil ratio, solids, and fluid-property changes.
- Assess mechanical restrictions, scale, wax, pump performance, and completion condition.
- Use pressure-transient, production, or nodal analysis to test the leading explanation.
🚫 Common Mistakes With Productivity Calculations
A frequent mistake is calculating PI from a single unstable test point and treating it as a fixed reservoir property. Another is mixing gauge pressures, absolute pressures, depths, or inconsistent rate units.
Engineers also risk overestimating gains by assuming PI remains constant while lowering bottomhole pressure through bubble point. Finally, a pressure drop across tubing or a choke should not be mistaken for a reservoir drawdown without locating where each pressure was measured.
🧠 A Practical Diagnostic Example
Imagine a hypothetical well whose oil rate falls after a separator operating pressure is increased. The reservoir has not suddenly changed, but the higher downstream pressure raises tubing and bottomhole pressure, reducing drawdown.
If nodal analysis shows the IPR is unchanged while the VLP curve shifts upward, attention should focus on the outflow system. Reducing avoidable backpressure may recover rate; acidizing the formation would address the wrong problem.
📊 What a PI Trend Can—and Cannot—Tell You
A declining PI trend can indicate depletion effects, worsening skin, higher viscosity, greater water saturation, changing phase behavior, or a completion restriction. It is a useful surveillance signal because it asks whether more pressure drop is now required for the same fluid rate.
It cannot identify the cause by itself. Pair PI trends with pressure data, test conditions, fluid trends, and equipment history. The most reliable interpretation comes from consistent measurements and a model that matches the well’s actual flow regime.
🧩 Reservoir Heterogeneity Complicates the Picture
Many reservoirs are not uniform radial-flow systems. Faults, shale barriers, fractures, layered sands, and unequal permeability can cause different zones to contribute at different rates and respond differently to drawdown.
A single average pressure and PI may still be useful for operations, but it can hide crossflow or early water entry from one interval. Zoned surveillance, production logging, and completion-aware models become more valuable as heterogeneity increases.
📚 Connecting the Formula to Daily Decisions
The pressure-rate relationship helps answer practical questions: Is the well limited by inflow or lifting capacity? Would a lower separator pressure help? Is a pump change likely to add oil or only water? Is stimulation justified by evidence of skin?
The best answer rarely comes from the equation alone. It comes from combining the equation with representative pressures, sound fluid data, an understanding of the completion, and respect for operating constraints.
🎯 The Core Principle Behind Well Productivity
Well productivity is fundamentally a balance between available reservoir pressure and all the resistances between the reservoir and the sales line. Drawdown supplies the driving force, while permeability, fluid mobility, skin, completion design, and outflow conditions determine how effectively that force becomes production.
Increasing pressure difference can raise rate, but only within the limits imposed by multiphase flow, formation integrity, water and gas movement, equipment capability, and long-term recovery objectives. Good engineering seeks the most valuable operating point, not merely the largest possible drawdown.
A well produces at the rate its pressure drawdown can overcome—after every reservoir, completion, wellbore, and surface restriction has taken its share. Reading that balance correctly turns a simple formula into better production decisions. 🛢️📉🔧