
A well is producing steadily, the tubing-head gauge looks reasonable, and the flow rate is close to plan. Then a production engineer asks a deceptively simple question: what is the pressure at the sandface? The answer cannot be read directly from a gauge at surface.
Bottomhole pressure influences nearly every production decision, from diagnosing excessive drawdown to selecting artificial lift and interpreting a well test. Yet downhole gauges are not always installed, may have failed, or may not represent the condition being evaluated.
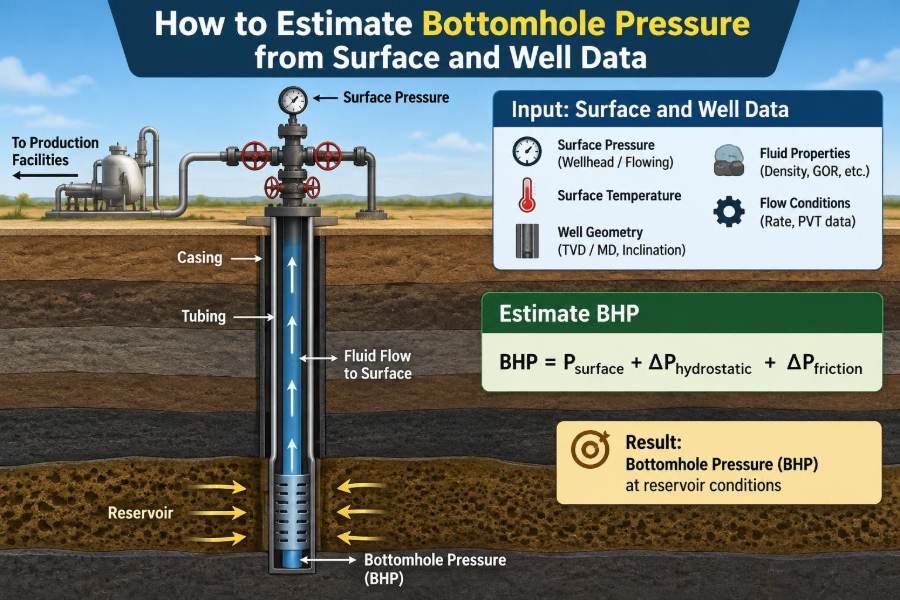
That is why engineers routinely estimate bottomhole pressure from measurements available at surface and from a description of the wellbore. The calculation is conceptually straightforward—follow pressure from one depth to another—but reliable results depend on using the right fluid model, depth reference, and operating data.
This guide develops the workflow from first principles. It focuses on flowing wells, while also showing where static estimates and more advanced multiphase models fit.
🎯 What Bottomhole Pressure Actually Means
Bottomhole pressure (BHP) is the fluid pressure at a specified downhole location. In production work, that location is often the midpoint of the perforated interval, the top perforation, or the sandface adjacent to the producing formation.
The exact location must be stated. A pressure at 8,000 ft measured depth is not automatically comparable with reservoir pressure reported at the perforation midpoint or with pressure at a gauge set below the tubing.
Engineers commonly distinguish between flowing bottomhole pressure, measured or estimated while the well is producing or injecting, and static bottomhole pressure, measured after sufficient shut-in time. They answer different questions and should not be substituted casually.
🧭 Why Surface Pressure Is Not Bottomhole Pressure
Surface pressure is affected by the column of fluid above the reference point, friction as fluid moves through tubing, and any acceleration associated with changing velocity or gas expansion. The downhole pressure reflects all of those effects accumulated along the well path.
A useful mental model is a vertical pipe full of fluid. Pressure usually rises as one moves downward because the lower fluid supports the weight of fluid above it. In a flowing well, however, friction acts against flow and complicates that simple hydrostatic picture.
For a producing well, moving from the wellhead down to the perforations usually adds hydrostatic pressure while accounting for pressure losses caused by upward flow. The net result depends strongly on whether the fluid is mostly liquid, gas, or a changing mixture of both.
📍 Choose the Pressure Location Before Calculating
Start every estimate by defining the target point and the surface reference point. Typical targets include the tubing intake, packer depth, perforation midpoint, and a permanent downhole gauge depth.
For example, if the purpose is to calculate production drawdown, the preferred pressure may be the flowing pressure at the perforation midpoint. If the purpose is sizing an electric submersible pump, the relevant pressure may be at pump intake instead.
Write the locations explicitly in the calculation sheet. Ambiguous labels such as “bottomhole” create avoidable errors when wells have long perforated intervals, multiple zones, or significant deviation.
📐 Measured Depth and True Vertical Depth
Measured depth (MD) is distance along the wellbore. True vertical depth (TVD) is vertical distance from a reference datum. Hydrostatic pressure is driven primarily by elevation change, so TVD—not MD—is the correct depth basis for the gravity term.
In a vertical well, MD and TVD are nearly equal. In a highly deviated or horizontal well, they can be dramatically different. Using the full lateral length as hydrostatic depth can produce an implausible pressure estimate.
Friction, by contrast, occurs along the flow path. Therefore, a rigorous calculation typically uses TVD for hydrostatic effects and MD, together with tubing geometry and flow rate, for friction effects.
🗺️ Establish a Consistent Depth Datum
Depth is only meaningful relative to a datum. Common references include ground level, rotary table, drill floor, mean sea level, and a subsea datum. Surface elevation must be reconciled with the depth reference used for perforations and pressure measurements.
A simple vertical-depth calculation can be wrong by the rig-floor elevation if one pressure is referenced to the wellhead and another depth is referenced to mean sea level. The numerical error may look small compared with total depth, but it can matter for low-density fluids or close pressure comparisons.
Use one declared datum throughout the calculation. If data arrive with different datums, convert them before applying any pressure-gradient equation.
🧾 Gather the Minimum Input Data
A defensible estimate begins with a complete snapshot of the well at the time of interest. Mixing a pressure recorded today with a production rate from last week is risky when operating conditions are changing.
- Surface pressure and its gauge location: tubing head, casing head, flowline, or separator.
- Target depth and its TVD and MD.
- Tubing inside diameter, completion geometry, and restrictions.
- Oil, water, and gas production rates, plus water cut and gas-oil ratio where available.
- Fluid properties: oil and water density or specific gravity, gas gravity, viscosity, temperature, and PVT data.
- Wellhead and downhole temperature estimates, flow direction, and choke status.
- Deviation survey and any downhole pressure survey available for calibration.
More information does not automatically guarantee a better answer. What matters is that the inputs are contemporaneous, correctly referenced, and appropriate for the chosen model.
🔎 Verify What the Surface Gauge Measures
“Wellhead pressure” can mean several things. Tubing-head pressure is not the same as casing pressure, and neither is necessarily the pressure upstream of a choke. A gauge downstream of a choke includes a potentially large pressure drop that does not belong in a tubing-pressure traverse.
Confirm whether the reading is gauge pressure or absolute pressure. Gauge pressure is referenced to atmospheric pressure; absolute pressure includes atmospheric pressure. Most wellbore calculations can use either convention if used consistently, but PVT correlations and gas properties often require absolute pressure.
Also consider gauge condition. A plugged sensing line, damaged gauge, poor calibration, or pulsating flow can make an otherwise sophisticated model useless.
💧 Start with the Hydrostatic Pressure Concept
For a static, incompressible liquid column, pressure change is described by:
ΔP = ρgΔzwhere ρ is fluid density, g is gravitational acceleration, and Δz is vertical depth change. In common oilfield field units, a water column has a gradient close to 0.433 psi/ft, with the exact value varying slightly with water density and unit convention.
If liquid specific gravity is known, a practical approximation is:
ΔP (psi) ≈ 0.433 × specific gravity × TVD (ft)This is the foundation of BHP estimation. It is also only a first approximation for a flowing, gas-containing well.
🛢️ Use Fluid Density Rather Than Assuming Water
Oil, brine, condensate, and completion fluid do not have the same density. A 5,000-ft column of light oil exerts substantially less hydrostatic pressure than a 5,000-ft column of dense brine.
Specific gravity expresses density relative to water. For a single liquid phase, it provides a convenient route to pressure gradient. For produced oil, API gravity can be converted to oil specific gravity when needed:
Oil specific gravity = 141.5 / (API gravity + 131.5)This conversion describes oil at its reference conditions. Downhole oil density may differ because pressure, temperature, dissolved gas, and formation volume factor change the fluid volume and density.
🌡️ Account for Temperature and PVT Behavior
PVT stands for pressure-volume-temperature behavior. It describes how reservoir fluids change as pressure and temperature change. These changes matter most when gas evolves from oil or when the well produces substantial free gas.
As pressure falls below bubblepoint, gas can come out of solution. The resulting mixture may become much less dense as it rises, especially near the upper wellbore. A calculation based on one constant oil density can then overestimate hydrostatic pressure.
Temperature also affects density and viscosity. For preliminary work, representative fluid properties may be acceptable, but a design or diagnostic decision should use laboratory PVT data or a validated fluid-property model where possible.
🧪 The Simple Static Liquid Estimate
Suppose a shut-in vertical well has a wellhead pressure of 300 psi. The target depth is 6,000 ft TVD, and the wellbore contains a liquid with specific gravity of 0.85. Ignoring small thermal and compressibility effects:
BHP ≈ 300 + (0.433 × 0.85 × 6,000)
BHP ≈ 2,508 psi
This example is hypothetical, but the logic is real: surface pressure plus the liquid-column pressure gives the deeper pressure. It can be a useful screening estimate for a liquid-filled, nonflowing well with known fluid density.
It should not be treated as a flowing-well calculation merely because the well happens to produce mostly liquid.
🏃 Why Flowing Wells Need More Than Hydrostatics
When fluid flows upward, energy is lost to wall friction, restrictions, and turbulence. At the same time, pressure falls and gas may expand, changing both mixture density and velocity. These effects are coupled.
A standard pressure-gradient view separates the total gradient into hydrostatic, frictional, and accelerational components:
dP/dL = hydrostatic component + friction component + acceleration componentThe signs depend on the selected direction and convention. The practical point is that a flowing pressure traverse must consider more than the weight of fluid.
🌬️ Gas Changes the Pressure Profile
Gas is highly compressible. A gas-liquid mixture near the bottom of a well may be relatively dense under high pressure, then become increasingly gas-rich and lower density toward surface as pressure declines.
That behavior means a single average density is often a poor representation of the entire well. It also explains why the upper portion of a gas-lifted or naturally flowing well can dominate uncertainty in a simple hydrostatic estimate.
Gas rate alone does not tell the full story. Pressure, temperature, liquid rate, tubing diameter, flow pattern, and gas entry depth all influence the mixture flowing in each segment.
🫧 Recognize Flow Regimes in Multiphase Flow
In multiphase flow, gas and liquid do not necessarily travel at the same velocity. This difference is called slip. Gas may rise faster than liquid, and the phase arrangement can change along the tubing.
Common descriptive flow regimes include bubble flow, slug flow, churn flow, annular flow, and mist flow. A regime is not merely a visual label: it affects liquid holdup, friction, and therefore the pressure gradient.
Because actual flow regimes are difficult to observe downhole, multiphase correlations estimate their effects from operating conditions and geometry. Their predictions are useful but inherently model-dependent.
📊 Select a Pressure-Traverse Method
Pressure-traverse methods range from hand calculations to commercial simulators. The suitable level of complexity depends on the decision being made and the quality of input data.
| Method | Best use | Main limitation |
|---|---|---|
| Static hydrostatic calculation | Liquid-filled shut-in wells and quick screening | Does not represent flowing friction or gas evolution |
| Average-gradient approximation | Early production estimates with moderate uncertainty | Depends heavily on assumed mixture density |
| Empirical multiphase correlation | Routine flowing BHP estimates | Accuracy varies by well and flow regime |
| Mechanistic model or simulator | Design, optimization, difficult multiphase systems | Needs detailed, reliable inputs and validation |
Names of correlations matter less than applicability and calibration. A model that matches a pressure survey in a comparable operating range is generally more useful than a theoretically appealing model used without validation.
🧮 Calculate in Depth Segments
For a flowing well, divide the trajectory into short segments. In each segment, estimate pressure, temperature, fluid properties, gas fraction, liquid holdup, velocity, and pressure gradient; then step to the next depth.
Segmenting matters because conditions can change greatly from bottom to top. A 100-ft increment may be appropriate in a rapidly changing multiphase region, while a longer increment may be acceptable in a stable liquid section.
The calculation is iterative because local pressure affects gas volume and density, which affect the next pressure change. Spreadsheet implementations can support simple methods, while dedicated software is often used for detailed models.
🧱 Include Tubing Geometry and Restrictions
Internal diameter controls velocity. For the same flow rate, smaller tubing raises velocity and usually increases frictional losses. Scale, wax, corrosion, partially closed sleeves, and deposits can reduce effective diameter even when the completion schematic says otherwise.
Restrictions require separate attention. A downhole safety valve, nipple, sliding sleeve, gas-lift valve, or choke can create a localized pressure loss not captured by treating the tubing as smooth, uniform pipe.
Use actual inside diameters, not nominal tubing size. The distinction becomes meaningful at high rates or in small tubing, where friction can be a major fraction of the total pressure change.
🔄 Treat Chokes and Flowline Losses Separately
Pressure upstream of the production choke belongs to the wellbore system; pressure downstream includes the choke loss and usually some flowline loss. Confusing these locations is a common source of poor BHP estimates.
If only separator pressure is available, work backward through the flowline and choke with appropriate models or measured pressure drops before beginning the tubing traverse. Each element should have a clear inlet and outlet pressure.
This system view is valuable for troubleshooting. A low separator pressure does not necessarily mean low tubing-head pressure, and a favorable tubing-head pressure does not necessarily imply low flowing BHP.
📉 Relate Flowing BHP to Drawdown
Drawdown is the difference between reservoir pressure near the well and flowing pressure at the sandface. In a simplified form:
Drawdown = reservoir pressure − flowing bottomhole pressureHigher drawdown can increase production rate, but it can also encourage gas or water coning, raise sand-production risk in susceptible formations, and reduce efficiency if the wellbore is the real restriction. The desirable drawdown is therefore a reservoir and completion question, not simply “the more, the better.”
When comparing BHP with reservoir pressure, ensure both pressures refer to compatible depths. A reservoir pressure datum may need to be shifted to the perforation depth using an appropriate formation-fluid gradient.
🛠️ Use BHP to Diagnose Artificial Lift Performance
Artificial lift changes the pressure profile deliberately. A rod pump reduces intake pressure to create drawdown; an ESP adds pressure across the pump; gas lift lowers flowing density by injecting gas; a flowing well may rely on its own gas expansion.
For pump surveillance, estimated intake pressure helps determine whether the pump is operating with adequate submergence and whether the well is being drawn down excessively. For gas lift, the modeled pressure profile helps assess injection depth, valve operation, and unloading behavior.
These applications demand caution. The uncertainty in a multiphase BHP estimate can be large enough to alter an operating decision, especially if rates or fluid properties are poorly known.
🧷 Calibrate Against Downhole Measurements
A pressure survey is the most valuable reality check for a model. Compare measured pressures at known depths with calculated pressures under as closely matched operating conditions as possible.
Do not “tune” a model by changing several uncertain inputs at once. First check depth datum, gauge location, surface-pressure reference, production rates, tubing dimensions, and fluid-property assumptions. Then adjust model choices or uncertain parameters in a documented way.
Calibration is not permanent. A model calibrated before water breakthrough, scale deposition, or a major rate change may no longer describe the well later.
⚠️ Understand the Major Sources of Uncertainty
An estimated BHP is an engineering interpretation, not a direct observation. Its uncertainty arises from measurements, fluid behavior, well geometry, and model limitations.
- Uncertain oil, water, and gas rates, especially allocation in commingled production.
- Inaccurate gas-oil ratio or gas rate at fluctuating conditions.
- Unknown liquid holdup and changing flow regime.
- Incomplete deviation survey or incorrect target TVD.
- Assumed temperature profile and imperfect PVT characterization.
- Unrecognized restrictions, deposits, leaks, or crossflow.
Report the method, key assumptions, and likely sensitivity rather than presenting a calculated value with false precision.
🧠 Run Sensitivity Checks Before Acting
A sensitivity check asks how much the result moves when uncertain inputs change within a plausible range. It is often more useful than adding another decimal place to a single calculation.
For example, test reasonable alternatives for gas rate, water cut, tubing roughness, and fluid density. If BHP changes little, the decision may be robust. If it changes substantially, obtaining a pressure survey or better production data may be worth more than further model refinement.
Focus on inputs that physically control the system. In a liquid-dominated well, liquid density and TVD may dominate; in a gassy well, gas rate, PVT behavior, and holdup assumptions can become more influential.
🚫 Avoid Common Calculation Mistakes
Several errors recur because they produce numbers that appear plausible. A plausible number is not necessarily a defensible one.
- Using MD instead of TVD for the hydrostatic column.
- Adding a full liquid hydrostatic gradient to a flowing gas-liquid well.
- Starting from separator pressure without accounting for the choke and flowline.
- Mixing gauge and absolute pressure in one calculation.
- Using rates and pressures from different operating conditions.
- Ignoring a pressure reference datum or target-depth definition.
- Assuming nominal tubing size equals actual internal diameter.
A short input-validation checklist prevents many of these problems before any equation is applied.
🧪 Separate Static, Shut-In, and Flowing Interpretations
Shutting in a well stops surface flow, but it does not instantly create uniform reservoir pressure at the gauge. Pressure must build up as transient flow dissipates, and the required time depends on reservoir and wellbore behavior.
A shut-in liquid-column estimate may be useful for operational checks, while a properly interpreted pressure buildup can provide reservoir information. They are related but not equivalent activities.
Similarly, a flowing BHP estimated during unstable cleanup, slugging, or severe rate changes may represent only a transient condition. Record the operating state alongside the pressure estimate.
💻 Build a Repeatable Calculation Workflow
A reliable workflow makes assumptions visible and lets another engineer reproduce the result.
- Define the decision, target pressure location, flow direction, and depth datum.
- Collect time-matched surface pressure, rates, temperatures, well geometry, deviation, and fluid data.
- Verify whether each pressure is gauge or absolute and identify its physical location.
- Choose the simplest method capable of supporting the decision.
- Calculate hydrostatic and flowing effects with appropriate depth bases and segmentation.
- Compare with any downhole survey, perform sensitivity checks, and document uncertainty.
- Update the model when completion configuration or operating conditions change.
This sequence is as relevant to a hand estimate as it is to a sophisticated nodal-analysis model.
📝 Document Assumptions So Results Stay Useful
A BHP number without context quickly loses value. A concise calculation record should state the date and time, well status, surface-pressure source, rates, fluid-property source, tubing configuration, target depth, correlation or method, and any calibration basis.
Include a statement such as “estimated flowing pressure at perforation midpoint using a segmented multiphase traverse” rather than simply “BHP.” This makes the result interpretable months later when someone compares it with a gauge survey or production test.
Clear documentation also separates measured data from inferred quantities. That distinction is central to sound engineering decisions.
✅ The Core Principle: Follow the Actual Pressure Path
Estimating bottomhole pressure is not about memorizing one gradient or selecting the most complicated simulator. It is about tracing pressure from a known point to a clearly defined downhole point while representing the fluid, geometry, and flow conditions realistically.
For a static liquid column, the hydrostatic calculation may be sufficient. For a producing multiphase well, density changes, slip, friction, restrictions, and trajectory demand a pressure-traverse approach. In both cases, good depth control and trustworthy inputs matter as much as the equation.
The strongest estimate is the one that is fit for its purpose, calibrated where possible, and presented with its assumptions and uncertainty.
Bottomhole pressure becomes useful when it is treated as a location-specific, condition-specific engineering estimate—not just a number copied into a report. That mindset leads to better surveillance, safer operating margins, and more credible production decisions. 🛢️📐📈