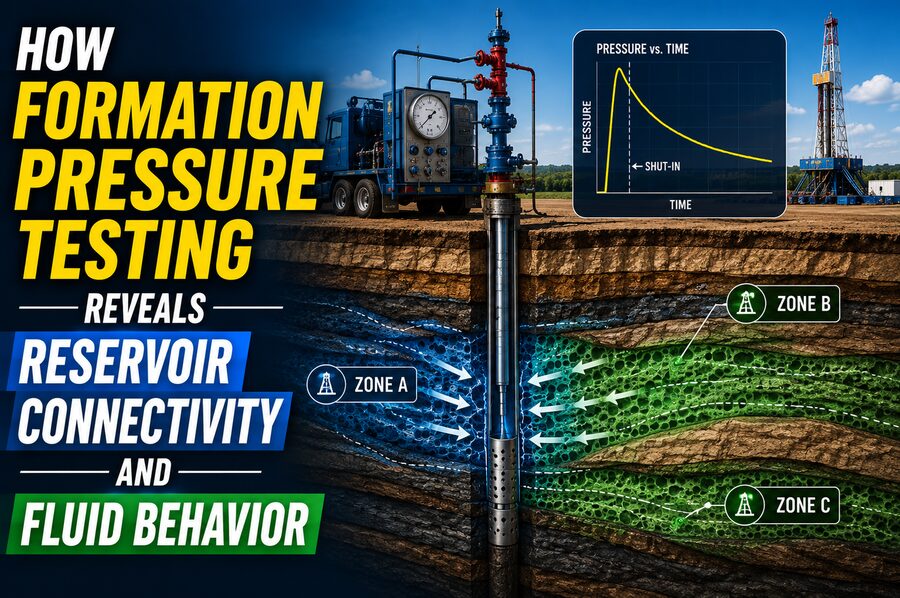

Deep underground, oil and gas reservoirs are not simply empty cavities filled with hydrocarbons. They are complex porous rock systems containing fluids under pressure, often divided into layers, compartments, and flow barriers that cannot be fully understood from seismic images or well logs alone. 🌍🧪
One of the most valuable ways engineers investigate these hidden reservoirs is through formation pressure testing.
Formation pressure testing measures the pressure of fluids inside the rock at specific depths. By collecting pressure data at many points in a well, engineers can learn much more than the pressure itself. They can infer:
- Whether different reservoir layers communicate with one another
- Where oil, gas, and water contacts may occur
- How fluid density changes with depth
- Whether faults or shale layers act as barriers
- How easily fluids move through the formation
- Whether a reservoir is depleted
- Whether several zones belong to the same pressure system
In other words, formation pressure testing turns a series of underground pressure measurements into a picture of reservoir connectivity and fluid behavior. 📊🛢️
🔍 What Is Formation Pressure?
Formation pressure is the pressure of the fluid contained inside the pore spaces of underground rock.
Reservoir rocks such as sandstone and carbonate contain tiny interconnected pores. These spaces may hold:
- Oil 🛢️
- Natural gas 🔥
- Formation water 💧
- Mixtures of several fluids
Because these fluids are buried beneath thousands of meters of rock, they can exist at very high pressures.
Formation pressure generally increases with depth because deeper fluids support the weight of fluids above them.
However, the exact pressure depends on factors such as:
- Fluid density
- Geological history
- Reservoir depletion
- Fluid production
- Injection
- Compartmentalization
- Pressure communication between layers
Measuring these pressures helps engineers understand how the reservoir behaves.
🧰 How Is Formation Pressure Measured?
Formation pressure is often measured using a wireline formation tester or a similar downhole pressure-testing tool.
The tool is lowered into an open wellbore and positioned against the rock at a selected depth.
A typical test involves a probe pressed firmly against the borehole wall.
A sealing pad isolates a small section of the formation from the wellbore fluid.
The tool then withdraws a small amount of fluid from the rock.
Pressure sensors monitor how the pressure changes during this process.
The basic sequence is:
- 📍 Position the tool at the target depth.
- 🔒 Press the probe and seal against the formation.
- 💧 Withdraw a small amount of formation fluid.
- 📉 Observe the pressure drop.
- 📈 Allow pressure to recover.
- 🧮 Estimate formation pressure from the stabilized value.
This process may be repeated at many depths to build a pressure profile through the reservoir.
📉 What Is a Pressure Pretest?
A formation pressure measurement often begins with a small pretest.
During the pretest, a chamber in the tool withdraws a small amount of fluid from the formation.
As fluid enters the tool, pressure near the probe falls.
This is called drawdown.
Once the chamber stops withdrawing fluid, pressure begins recovering toward the undisturbed formation pressure.
This is called pressure buildup.
The pressure response can tell engineers several things.
A rapid recovery may indicate that fluid can move through the rock relatively easily.
A slow recovery may suggest lower mobility or permeability.
A poor seal or extremely tight formation can make the measurement less reliable.
Thus, even a small pressure test contains information about both pressure and fluid flow behavior. ⚙️
🧠 Why Pressure vs. Depth Is So Important
One isolated pressure reading is useful.
A series of measurements at different depths is far more powerful.
If engineers plot:
Pressure on the horizontal axis
and
Depth on the vertical axis
the data often form approximately straight trends within a continuous fluid column.
The slope of that line is called the pressure gradient.
Different fluids have different densities, so they create different pressure gradients.
For example:
- Gas generally has a relatively low pressure gradient
- Oil usually has a higher gradient than gas
- Water typically has a higher gradient than many reservoir oils
This means pressure data can help distinguish fluid types even before large fluid samples are recovered. 📈
💧 How Pressure Gradients Reveal Fluid Density
The relationship between pressure and depth is strongly influenced by fluid density.
In simple hydrostatic conditions:
Pressure gradient ≈ fluid density × gravitational acceleration
A denser fluid produces a larger pressure increase with depth.
Suppose a series of pressure measurements forms one slope in the upper reservoir and another slope deeper down.
The change may indicate a transition from:
Gas ➡️ Oil
or:
Oil ➡️ Water
By extrapolating the pressure trends, engineers can estimate where the two fluid columns would be in pressure equilibrium.
That intersection may indicate a fluid contact.
🛢️ Detecting the Oil–Water Contact
Imagine several pressure measurements in an oil zone and several more in a water zone.
The oil measurements form one pressure-gradient line.
The water measurements form a steeper line because water is typically denser.
Where those two lines intersect, oil and water would have equal pressure.
That depth can approximate the oil–water contact, often abbreviated OWC.
This technique can be especially valuable when conventional well logs do not clearly identify the contact.
Pressure data may therefore help confirm whether a lower interval contains movable water, oil, or a transition between them. 💧🛢️
🔥 Identifying Gas–Oil Contacts
The same principle can be used for a gas–oil contact.
Gas has a much lower density than oil.
Therefore, its pressure gradient is usually much smaller.
If pressure points in an upper zone follow a shallow gradient and lower pressure points follow a steeper oil gradient, the intersection between the two trends may indicate the gas–oil contact.
This information is extremely important for estimating:
- Hydrocarbon column height
- Reservoir volumes
- Original hydrocarbons in place
- Development strategy
A few carefully collected pressure measurements can therefore influence billion-dollar field-development decisions. 💰
🔗 How Pressure Testing Reveals Reservoir Connectivity
One of the most important applications of formation pressure testing is determining whether different reservoir zones are hydraulically connected.
Suppose two sand layers are separated by a shale bed.
If pressure measurements from both layers lie on the same consistent pressure trend, this suggests that fluids may be communicating between them.
The layers could be connected through:
- Permeable rock pathways
- Faults that transmit fluids
- Thin connections not clearly visible on logs
- Lateral communication away from the well
If the pressures are distinctly different, however, the layers may be isolated.
This can indicate reservoir compartmentalization.
🧱 What Is Reservoir Compartmentalization?
A reservoir may look continuous on a seismic image but actually consist of multiple pressure compartments.
Barriers may include:
- Sealing faults
- Shale layers
- Tight rock
- Cemented intervals
- Stratigraphic changes
If these barriers prevent fluid movement, each compartment can develop its own pressure.
For example:
Upper reservoir pressure: 5,200 psi
Lower reservoir pressure: 4,750 psi
If both zones are at comparable depths but have significantly different pressures, this may indicate poor communication.
Such information can fundamentally change the development plan.
Instead of one production well draining the entire reservoir, several wells may be required to access separate compartments. 🏗️
🧭 Faults: Barriers or Pathways?
Faults can behave in two very different ways.
Some faults act as seals, preventing fluids from crossing.
Others act as conduits, allowing fluids to migrate.
Formation pressure data can help determine which behavior is occurring.
Suppose wells on opposite sides of a fault show nearly identical pressure trends and similar fluid contacts.
This may suggest pressure communication across the fault.
If the pressures differ strongly, the fault may be sealing.
This interpretation is particularly valuable because seismic data may reveal the location of a fault but not always its hydraulic behavior.
Pressure testing helps reveal what the fault is actually doing underground. 🌍
📊 Comparing Pressure Between Wells
Formation pressure testing becomes even more powerful when data from multiple wells are compared.
Imagine three wells drilled several kilometers apart.
If all three show:
- Similar pressure gradients
- Similar formation pressures at equivalent depths
- Similar fluid contacts
the reservoir may be laterally connected over a large area.
But if one well has noticeably lower pressure, it could indicate:
- A separate compartment
- Local depletion
- A pressure barrier
- Different fluid systems
Engineers can combine this information with seismic interpretation and geological models to build a much more realistic reservoir description.
⛽ How Production Changes Formation Pressure
Reservoir pressure does not remain constant forever.
When oil or gas is produced, pressure generally declines unless pressure support is provided by mechanisms such as:
- Aquifer influx
- Gas-cap expansion
- Water injection
- Gas injection
Formation pressure testing in new development wells can reveal whether nearby producing wells have already affected the area.
Suppose the original reservoir pressure was 6,000 psi.
Several years later, a new well measures 5,300 psi.
This depletion may indicate that the new well is connected to the producing portion of the field.
If pressure remains close to 6,000 psi, however, the new well might lie in an isolated compartment.
Thus depletion itself becomes a connectivity tracer. 🔄
🌊 Pressure Communication Does Not Always Mean High Flow Capacity
An important distinction exists between pressure communication and strong production connectivity.
Two reservoir sections may transmit pressure over long periods even if fluid flow between them is relatively slow.
A thin, low-permeability connection might eventually equalize pressure while still providing limited production support.
Therefore, pressure similarity does not automatically prove that two zones will behave as one highly productive reservoir.
Engineers combine pressure data with:
- Well tests
- Production history
- Interference tests
- Core analysis
- Seismic interpretation
- Reservoir simulation
to understand the full picture.
💨 What Is Formation Mobility?
During a formation pressure test, the way pressure responds to fluid withdrawal can provide an estimate related to mobility.
Mobility is approximately:
Mobility = Permeability / Fluid viscosity
High-permeability rock containing a low-viscosity fluid may have high mobility.
Low-permeability rock or very viscous oil may have lower mobility.
A formation with high mobility can supply fluid to the tool quickly, causing pressure to stabilize faster.
A low-mobility zone may recover slowly.
This helps engineers decide whether a particular interval is likely to flow effectively. ⚙️
🪨 Permeability vs. Porosity
Formation pressure testing also highlights an important reservoir concept.
Porosity describes how much pore space exists.
Permeability describes how easily those pores are connected for fluid flow.
A rock can have significant porosity yet very low permeability.
In that case, it may contain substantial hydrocarbons but release them slowly.
Pressure-testing response can provide clues about this flow capacity.
This is why formation pressure testing complements conventional well logs, which may identify fluid-bearing rock without fully revealing how easily those fluids can move.
🧪 Formation Fluid Sampling
Many modern formation-testing tools can do more than measure pressure.
They can also withdraw formation fluid and collect samples.
However, the wellbore is usually filled with drilling mud, and some drilling-fluid filtrate may invade the formation near the well.
Initial fluid entering the tool may therefore contain contamination.
The tool can continue pumping fluid while monitoring properties such as:
- Optical response
- Electrical resistivity
- Density
- Composition indicators
- Gas-to-oil characteristics
Once contamination declines sufficiently, a sample can be captured in a high-pressure chamber for laboratory analysis. 🧫
🧬 What Fluid Samples Reveal
High-quality formation-fluid samples can be analyzed using PVT testing, where PVT stands for:
Pressure, Volume, Temperature
Laboratories can determine properties such as:
- Oil density
- Gas composition
- Gas–oil ratio
- Viscosity
- Bubble-point pressure
- Formation volume factor
- Fluid compressibility
These measurements are essential for predicting how reservoir fluids behave as pressure changes during production.
Formation testing therefore connects pressure interpretation with actual fluid-property analysis.
🫧 Bubble Point and Phase Behavior
Reservoir oil may contain substantial quantities of dissolved natural gas.
At high reservoir pressure, that gas remains dissolved in the liquid.
As pressure decreases, a critical value known as the bubble-point pressure may be reached.
Below this pressure, gas begins coming out of solution.
This can change:
- Fluid viscosity
- Relative permeability
- Well productivity
- Reservoir pressure support
- Surface production behavior
Pressure data help engineers determine how close the reservoir is to important phase boundaries.
That information influences depletion strategy and pressure-maintenance plans. 🔥🛢️
📉 Drawdown Behavior During Testing
During the pretest, engineers pay attention to how pressure falls when fluid is withdrawn.
A highly permeable formation may show only a modest pressure drop.
A tight formation may require a much larger drawdown to obtain fluid.
Excessive drawdown can cause problems, including:
- Gas liberation
- Sand movement
- Seal failure
- Nonrepresentative measurements
Therefore, sophisticated tools carefully control the pretest volume and pumping rate.
The objective is to disturb the reservoir as little as possible while still obtaining reliable information.
⚠️ What Is Supercharging?
Formation pressure measurements can sometimes be artificially high because of supercharging.
This occurs when drilling-fluid filtrate invades the formation and raises pressure near the borehole above the true undisturbed reservoir pressure.
The effect is particularly significant in low-permeability formations.
A measurement taken too quickly may therefore overestimate formation pressure.
Engineers recognize possible supercharging by examining:
- Pressure buildup shape
- Permeability
- Mud properties
- Repeated measurements
- Nearby pressure trends
Careful interpretation is essential because not every measured pressure is automatically the true reservoir pressure. 🎯
🧱 Why Tight Formations Are Difficult to Test
In highly permeable rock, fluid moves toward the probe relatively easily.
In very tight formations, recovery can take much longer.
Pressure may fail to stabilize within the available station time.
This creates uncertainty.
Engineers may need to:
- Extend the buildup period
- Perform repeated tests
- Change drawdown volume
- Use specialized probes
- Combine pressure data with other measurements
Poor-quality pressure stations are often excluded from gradient interpretation.
A few bad points can otherwise create a misleading picture of fluid contacts or connectivity.
📐 Pressure Gradients Must Be Interpreted Carefully
In ideal conditions, pressure points form clean straight lines.
Real reservoirs can be more complicated.
Gradient interpretation may be affected by:
- Temperature variation
- Fluid composition changes
- Capillary pressure
- Depletion
- Measurement uncertainty
- Vertical flow barriers
- Transition zones
For example, oil composition may change gradually with depth.
That means density may also vary, causing the pressure gradient to curve slightly instead of forming one perfect straight line.
Engineers therefore combine pressure measurements with fluid samples and geological information.
🧲 Capillary Pressure and Fluid Contacts
At the pore scale, oil and water do not always meet at one perfectly sharp horizontal boundary.
Capillary forces can create a transition zone in which water saturation changes gradually with depth.
The pressure equilibrium between fluids can therefore involve capillary pressure.
As a result, contacts inferred from pressure gradients may not perfectly match saturation changes observed on logs.
This is not necessarily a contradiction.
Pressure measurements, saturation logs, and capillary-pressure data describe different aspects of the same reservoir system. 🧪
🗺️ Building a Reservoir Model
Formation pressure data are fed into three-dimensional reservoir models.
Engineers use the data to define:
- Pressure compartments
- Fluid contacts
- Vertical communication
- Fault behavior
- Initial reservoir pressure
- Depletion patterns
Reservoir simulation software then predicts how fluids may move during years or decades of production.
A wrong connectivity assumption can produce major forecasting errors.
For example, assuming two zones communicate when they actually do not could lead engineers to overestimate how much reservoir volume a single well can drain.
Pressure testing reduces that uncertainty. 📊
💧 Evaluating Aquifer Support
Some oil reservoirs are connected to large underground water systems called aquifers.
As oil is produced, water may expand or flow into the reservoir, helping maintain pressure.
Repeated pressure measurements can reveal whether this support is occurring.
If substantial production causes only modest pressure decline, a strong aquifer may be present.
If pressure falls rapidly, pressure support may be weak.
Understanding aquifer strength is important because it affects:
- Production forecasts
- Water breakthrough
- Recovery factor
- Need for water injection
Formation-pressure information is therefore central to reservoir-management decisions.
💉 Evaluating Injection Connectivity
Water or gas is often injected into reservoirs to maintain pressure or improve hydrocarbon recovery.
Engineers need to know whether the injected fluid is communicating with production wells.
If pressure in nearby reservoir zones rises after injection begins, it may indicate hydraulic connectivity.
If an adjacent compartment remains unaffected, a barrier may be separating it from the injector.
Pressure data can therefore help optimize:
- Injector placement
- Injection rates
- Pattern design
- Pressure support
This can improve field-wide recovery efficiency. 🔄
🏭 Why Reservoir Connectivity Matters Economically
Reservoir connectivity directly affects how many wells must be drilled.
If a large reservoir is strongly connected, one well may drain a substantial area.
If the same geological body is divided into numerous sealed compartments, many wells may be required.
Each offshore development well can be extremely expensive.
Therefore, discovering connectivity before committing to a large drilling program can save enormous amounts of money.
Formation pressure testing is valuable not merely as a scientific exercise, but as a tool for reducing development risk. 💰🛢️
🔗 Integration With Other Reservoir Data
Pressure testing is strongest when combined with other information.
Engineers often integrate it with:
- Seismic surveys 🌍
- Gamma-ray logs
- Resistivity logs
- Density and neutron logs
- Core samples
- Production tests
- Drill-stem tests
- Fluid analysis
- Geological interpretation
For example, seismic data might show a fault.
Pressure measurements can help determine whether it seals.
Logs might show two sandstone layers.
Pressure gradients can indicate whether they share the same fluid system.
The combination produces far greater confidence than any single measurement alone.
🛰️ Modern Downhole Formation Testing
Modern formation-testing systems have become highly sophisticated.
Advanced tools may include:
- Multiple pressure gauges
- Multiple probes
- Dual packers
- Downhole pumps
- Optical fluid analyzers
- Resistivity sensors
- Sample chambers
- Real-time telemetry
Dual-packer systems can isolate a larger section of the borehole than a small probe.
This can be useful in fractured formations or when larger fluid volumes are needed.
Some tools can perform mini-drill-stem-test-style measurements while still on wireline or other conveyance systems.
These technologies provide increasingly detailed information about reservoir behavior before the well begins production. 🚀
🤖 Digital Analysis and Reservoir Interpretation
Formation pressure interpretation is increasingly assisted by advanced software.
Algorithms can automatically:
- Identify stable pressure points
- Fit pressure gradients
- Detect outliers
- Estimate fluid contacts
- Compare pressure compartments
- Integrate PVT information
Machine-learning techniques may also help recognize patterns across large datasets.
However, geological context remains essential.
A mathematically perfect pressure trend can still be interpreted incorrectly if the reservoir architecture is misunderstood.
Human engineering judgment and geological knowledge remain important. 🧠💻
⚠️ Limitations of Formation Pressure Testing
Although formation pressure testing is extremely powerful, it has limitations.
Measurements can be affected by:
- Poor probe seals
- Mud filtrate invasion
- Supercharging
- Low permeability
- Tool movement
- Borehole rugosity
- Insufficient buildup time
- Sensor uncertainty
Pressure gradients may also become ambiguous when only a few valid pressure stations are available.
Therefore, engineers assess the quality of every measurement before using it for reservoir interpretation.
A pressure point is not valuable merely because a tool recorded a number—the measurement must be representative of the formation.
🛢️ Final Thoughts
Formation pressure testing is one of the most informative ways to investigate a reservoir before or during development.
By measuring pressure at multiple depths, engineers can determine far more than simply how many pounds per square inch exist underground.
Pressure trends can reveal:
- Fluid density and type 💧🛢️🔥
- Gas–oil and oil–water contacts
- Reservoir pressure compartments
- Communication across faults and layers
- Formation mobility
- Depletion from nearby production
- Pressure support from aquifers or injection
The core principle is straightforward:
Connected fluids tend to establish related pressure systems, while barriers allow different pressure conditions to develop.
By studying how pressure changes with depth and how it responds when small quantities of fluid are withdrawn, reservoir engineers can infer the hidden architecture of the underground system.
That information affects where wells are drilled, how many wells are required, how production should be managed, and how much oil or gas may ultimately be recovered.
In a reservoir thousands of meters below the surface, direct observation is impossible. Yet a carefully measured pressure response can reveal whether distant rock layers communicate, which fluids occupy them, and how those fluids are likely to behave during production.
That is why formation pressure testing remains one of the most powerful diagnostic tools in petroleum reservoir engineering. 🛢️📊🌍