
A production engineer begins the morning with familiar questions: Why did water cut rise on this well? Is the compressor approaching a trip? Which wells can be safely choked back without sacrificing the day’s target?
Not long ago, answering those questions often meant assembling reports from several systems, calling the field, and interpreting measurements that might already be hours old. The decisions were still engineering decisions, but the path to them was slow and fragmented.
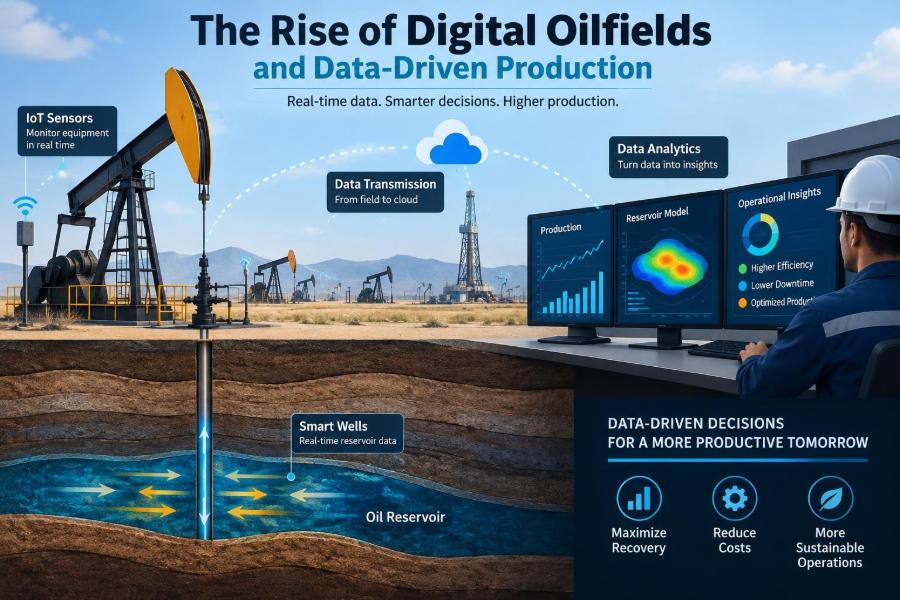
A digital oilfield changes that path. It connects field measurements, engineering models, workflows, and people so that operational decisions can be made with better context and, in some cases, much faster.
The technology matters because mature assets are increasingly complex. Wells, facilities, reservoirs, emissions controls, maintenance constraints, and commercial limits interact constantly. Better data does not remove those trade-offs, but it can make them visible before they become expensive surprises.
🛢️ What a Digital Oilfield Actually Means
A digital oilfield is not one software package or a control room filled with screens. It is an operating approach that uses connected data, digital tools, and disciplined workflows to improve decisions across exploration, drilling, production, maintenance, and abandonment.
For production operations, the focus is often on combining real-time or near-real-time field data with longer-term engineering information. That may include well tests, pressure surveys, equipment histories, production forecasts, and reservoir models.
The goal is practical: help the right person recognize a developing condition, understand its likely causes, and choose a defensible action.
📊 Why Production Operations Are Especially Suitable
Production generates a steady stream of measurements. Flow rates, pressures, temperatures, vibration, valve positions, tank levels, and power consumption can all change as a field responds to reservoir depletion, equipment performance, and operator actions.
Many production decisions are also repetitive. Engineers routinely prioritize well interventions, tune artificial lift, investigate allocation discrepancies, manage facility bottlenecks, and schedule maintenance. These patterns make production a natural setting for analytics and workflow automation.
Yet suitability is not simplicity. A sensor reading can be wrong, a well test can be unrepresentative, and an apparently optimal surface action can damage longer-term reservoir value. Digital tools must operate within sound petroleum engineering judgment.
🔗 The Data Chain From Reservoir to Decision
Digital production starts with a data chain. Information moves from sensors and manual observations through communications systems, storage platforms, validation routines, engineering applications, and finally into an operational decision.
A weak link can limit the entire system. A highly detailed dashboard is of little value if the pressure transmitter is poorly calibrated, the tag names are ambiguous, or data arrive too late to influence action.
A useful question is: what decision will this data improve? Starting there prevents teams from collecting data merely because a new device can produce it.
📡 Field Sensors: The Physical Foundation
Pressure, temperature, differential pressure, level, flow, vibration, and electrical measurements form much of the digital oilfield’s raw material. Downhole gauges may provide additional insight into bottomhole pressure and temperature, while surface instrumentation tracks the well and facility response.
Each measurement has limitations. A flow meter may perform differently as gas fraction changes. A pressure signal may include pulsation. A level transmitter can drift because of fouling, density variation, or installation geometry.
Instrumentation therefore needs engineering context. A value is not automatically a fact simply because it appears on a screen.
📶 Connectivity Beyond the Control Room
Remote pads, offshore installations, pipelines, and central processing facilities need reliable paths for data transmission. Depending on location and criticality, systems may use wired networks, radio, cellular connections, satellite communication, or combinations of these.
Communication design involves trade-offs among bandwidth, power use, latency, coverage, cost, and resilience. A remote solar-powered site cannot necessarily support the same data volume as a large processing plant.
Loss of communication should also be anticipated. Local control logic and safe operating procedures must not depend on a cloud connection remaining available.
🧭 SCADA, DCS, and the Operational Backbone
SCADA, or supervisory control and data acquisition, commonly collects remote field data and enables supervisory monitoring. A distributed control system (DCS) is more typical within processing facilities, where many control loops operate continuously.
These systems are designed around operations and control, not necessarily around reservoir analysis or enterprise reporting. A digital oilfield often connects them to historians and other data platforms while preserving the separation needed for safe and secure control environments.
Operators should never be asked to treat an analytics screen as a replacement for control-system alarms, procedures, or established authority.
🗄️ Data Historians and Engineering Records
A data historian stores time-series process data: values indexed by time. It lets engineers inspect what happened before, during, and after an event, such as a separator pressure upset or a pump shutdown.
But production understanding also depends on less tidy records: well schematics, completion details, PVT data, test reports, intervention notes, chemical usage, and laboratory analyses. These records are often stored in separate systems or documents.
Connecting structured signals with engineering records turns a trend into a more useful story. A rising tubing pressure means more when the analyst knows the choke change, lift method, and recent workover history.
🧹 Data Quality Comes Before Analytics
Data quality is one of the least glamorous and most decisive parts of digital transformation. Common problems include missing points, duplicated tags, impossible values, inconsistent units, incorrect timestamps, and signals that remain frozen at one number after an instrument failure.
Validation rules can flag suspicious readings, but rules require careful configuration. A pressure above an expected range may indicate a fault, a transient, or a genuinely abnormal operating condition that deserves immediate attention.
- Define ownership for critical tags and measurements.
- Document units, locations, calibration status, and intended use.
- Distinguish measured values from calculated or manually entered values.
- Review data quality routinely rather than only after an incident.
🏷️ Context Turns Tags Into Engineering Information
A tag named PT-204 does not explain much by itself. Context identifies where the transmitter sits, what it measures, its range and units, which equipment it belongs to, and whether it is used for control, monitoring, or safeguarding.
This context is often described through asset hierarchies, metadata, and standardized naming. It may feel administrative, but it makes cross-disciplinary analysis much safer and faster.
Without it, an analyst can compare the wrong pressures, apply an unsuitable limit, or confuse two similar wells. Digital systems scale only when their meanings scale with them.
🧠 From Raw Data to Actionable Insight
Raw data answer “what was measured?” Analytics aim to answer broader questions: What changed? Is the change unusual? What is probably driving it? What action is worth considering?
Different analytical methods serve different purposes. A simple moving average may reveal a gradual decline. A mass-balance calculation may expose an allocation issue. A machine-learning model may identify complex patterns that are difficult to represent with a single equation.
The strongest workflow usually combines methods rather than treating one technique as universally superior.
📈 Descriptive Analytics: Seeing What Happened
Descriptive analytics organizes historical and current performance into trends, plots, balances, and dashboards. It is the foundation for daily surveillance because it makes deviations visible.
For example, plotting oil rate, water rate, gas rate, flowing tubing pressure, choke position, and electrical load together may show whether a production decline coincided with an operating change.
A dashboard should be designed around a task, not around displaying every available tag. Too many indicators can hide the one pattern that needs attention.
🔮 Predictive Analytics: Estimating What May Happen
Predictive analytics uses past behavior and current inputs to estimate future outcomes or likely conditions. Examples include forecasting equipment failure risk, estimating virtual flow rates, or anticipating when a facility constraint may be reached.
Predictions are conditional, not promises. A model trained on normal pump operation may be unreliable after a major equipment modification, a change in fluid properties, or an operating regime it has never seen.
Teams should communicate prediction uncertainty clearly. A ranked maintenance risk can guide inspection priorities; it should not be mistaken for proof that failure is inevitable.
🎯 Prescriptive Analytics: Choosing an Action
Prescriptive analytics goes one step further by comparing possible actions against objectives and constraints. It may recommend a choke setting, lift-gas allocation, routing plan, or maintenance sequence.
Production optimization is rarely a single-variable problem. Increasing one well’s rate can reduce separator capacity, alter gas compression demand, increase water handling, or affect drawdown in connected wells.
A good prescriptive tool makes its assumptions visible: the objective function, equipment limits, operating envelopes, and penalties applied for risk or uncertainty.
🧪 Physics-Based Models Still Matter
Petroleum engineering remains governed by fluid flow, phase behavior, heat transfer, rock properties, and mechanical limits. Physics-based models represent these relationships explicitly through equations and calibrated parameters.
Nodal analysis, for instance, connects inflow from the reservoir with outflow through the wellbore and surface system. It can help assess how a change in choke size, tubing performance, or flowing pressure affects the operating point.
These models may require substantial input quality and updating, but they are valuable because engineers can inspect whether their behavior remains physically plausible.
🤖 Machine Learning and Its Proper Role
Machine learning can uncover patterns in high-dimensional data, such as combinations of vibration, temperature, load, and operating conditions associated with equipment behavior. It is especially useful where relationships are nonlinear or where large volumes of labelled history exist.
Its limitations are equally relevant. A model may learn correlations caused by operating practices rather than physical causes. It can also perform poorly when the process changes or when rare failure examples are scarce.
The practical question is not “can machine learning be used?” It is “does it improve this decision beyond a simpler method, and can engineers validate its output?”
🪞 Digital Twins: Useful, but Not Magical
A digital twin is a digital representation of a physical asset, process, or system that is updated with operational data. In oil and gas, a twin might represent a well, an electric submersible pump, a compression train, or an entire production network.
Its value comes from testing scenarios safely. Engineers can examine the likely consequences of a set-point change, routing adjustment, or equipment degradation before acting in the field.
A twin is only as credible as its model structure, inputs, and calibration. Calling any visualization a “twin” does not create predictive capability.
🛠️ Artificial Lift Surveillance
Artificial lift systems are frequent targets for digital surveillance because their operating signals can change before production loss becomes obvious. For an electric submersible pump, engineers may examine motor current, intake pressure, discharge pressure, frequency, temperature, vibration, and fluid rate.
Patterns can suggest gas interference, scale buildup, worn components, restricted flow, or operation away from the preferred range. However, the same symptom can have more than one cause.
Digital surveillance is most useful when it prompts a structured review: verify instruments, check operating conditions, compare with the well model, and then decide whether an operational adjustment or field inspection is justified.
💧 Water Management and Produced-Water Insight
As fields mature, produced water can become a major constraint on production capacity, chemical programs, corrosion management, disposal, and environmental performance. Water rate alone does not explain the whole problem.
Data-driven workflows can combine water cut, salinity, pressure behavior, tracer or surveillance information where available, and facility capacity to identify changing patterns. The purpose may be to prioritize diagnostics, adjust handling, or evaluate conformance actions.
Interpretation requires caution. A water-cut increase may reflect reservoir movement, completion behavior, changing allocation, or a measurement issue—not necessarily a single reservoir mechanism.
🌬️ Emissions, Energy, and Operational Efficiency
Digital monitoring can support energy and emissions management by making fuel use, compressor efficiency, flaring, venting, methane detection signals, and power demand more visible to operations teams.
For example, an abnormal compressor operating condition may increase energy use while reducing throughput. Identifying the condition early can support both production reliability and lower energy intensity.
Measurement boundaries matter. Emissions calculations depend on equipment coverage, meter quality, operating assumptions, and reporting methodology. Digital tools improve traceability, but they do not eliminate uncertainty in the underlying inventory.
⚙️ Production Optimization Across the Network
Optimizing a single well can be misleading when wells share manifolds, separators, compressors, water-treatment equipment, pipelines, or export limits. The asset’s best outcome often depends on the network rather than on one well’s maximum rate.
Network models help engineers consider interactions. A hypothetical example is a high-gas well whose choke increase raises its oil rate but consumes compression capacity needed by several other wells. The apparent local gain may become a total production loss.
Effective optimization therefore needs shared objectives and agreed constraints across reservoir, production, process, and operations teams.
🚨 Alarm Management Is Not Just More Alarms
Digital systems can generate thousands of notifications, especially when thresholds are copied broadly without considering process dynamics. Excess alarms create alarm fatigue, where people become less able to recognize the signals that truly demand attention.
Alerts should have a defined purpose, priority, owner, and response expectation. A dashboard notification about declining performance is different from a control-system alarm requiring immediate operator action.
Rationalization, deadbands, delay settings, suppression during known conditions, and regular review can reduce noise while protecting critical awareness.
🧑🏭 The Human Role Does Not Disappear
Automation changes work; it does not remove the need for skilled people. Field operators contribute observations that sensors may miss, such as unusual noise, leaks, vibration, access limitations, or changes after maintenance.
Engineers provide physical interpretation and understand commercial, safety, and reservoir consequences. Data specialists can build pipelines and models, but they need domain guidance to avoid optimizing an irrelevant proxy.
The most capable digital oilfields strengthen collaboration instead of treating technology as a substitute for operational experience.
🧩 Cross-Functional Workflows Make Value Real
Value is created when insight moves into a repeatable workflow. A corrosion-risk flag, for example, should lead to defined review steps, evidence requirements, responsible roles, and records of the resulting decision.
Useful workflows commonly connect production, facilities, maintenance, integrity, subsurface, and HSE functions. They specify where a decision sits: at the field level, the daily production meeting, a technical authority review, or a formal management-of-change process.
Without this structure, analytics can become an interesting report that nobody is accountable for using.
🛡️ Cybersecurity and Operational Technology Risk
Connecting equipment expands the digital attack surface. Operational technology, often shortened to OT, includes the systems that monitor or control physical processes. Its security priorities differ from ordinary office IT because availability and safe operation are central.
Practical safeguards include network segmentation, controlled remote access, asset inventories, patch-management processes appropriate to critical systems, backups, logging, and incident response plans. These measures must be designed around operations, not imposed without understanding process consequences.
Cybersecurity is also a people issue. Weak credentials, unmanaged vendor access, and informal data transfers can undermine otherwise sophisticated technical controls.
✅ Data Governance and Decision Trust
Data governance defines who owns data, who can change it, how quality is assessed, and which version is trusted for a given decision. It sounds formal, but it prevents costly arguments over whose rate, pressure, or well status is correct.
Governance should be proportionate. Critical production allocation data may need strict approval and auditability, while an engineer’s exploratory analysis may need flexibility and speed.
Trust grows when users can trace a displayed number back to its source, transformations, assumptions, and timestamp.
📏 Measuring Value Without Inflating Claims
Digital initiatives should be evaluated against specific operational outcomes rather than vague claims of “transformation.” Depending on the use case, relevant measures might include deferred-production duration, unplanned downtime, time spent finding data, maintenance effectiveness, energy intensity, or forecast accuracy.
Attribution is difficult. Production can change because of reservoir behavior, market constraints, weather, maintenance, or facility conditions. A careful evaluation compares the decision process and outcome against a credible baseline rather than assigning every improvement to software.
Small, verified improvements in a recurring workflow can be more valuable than a dramatic demonstration that cannot be sustained.
🚧 Common Failure Modes in Digital Oilfield Programs
Several patterns repeatedly weaken otherwise promising projects:
- Starting with a platform purchase instead of a well-defined operational problem.
- Building models from poorly maintained or poorly contextualized data.
- Deploying dashboards without changing the workflow that uses them.
- Ignoring field users during design and expecting adoption afterward.
- Automating recommendations without clear operating limits or human review.
- Assuming a successful pilot will scale without attention to integration, support, and governance.
These failures are rarely caused by technology alone. They usually reflect gaps between data science, engineering practice, and the realities of operating assets.
🧱 Starting With a Practical Use Case
A sensible starting point is a problem that is frequent, material, measurable, and within the organization’s ability to act on. Examples may include reducing time to identify shut-in wells, improving artificial-lift surveillance, reconciling production data, or prioritizing maintenance inspections.
Define the current workflow first. Who detects the issue now? What information is missing? How long does assessment take? What prevents action? These questions identify whether the bottleneck is data access, model quality, authority, field execution, or something else.
Then create a minimum viable solution and test it with the people who will use it under real operating conditions.
🧭 A Sensible Implementation Sequence
Digital oilfield development works best as an iterative engineering program rather than a one-time installation. A practical sequence is:
- Frame the operational decision and success measure.
- Map required data sources, quality issues, and owners.
- Build and validate a simple workflow or model.
- Run it alongside existing practice and compare outputs.
- Train users, document limits, and establish support.
- Scale only after the process is reliable and adopted.
This approach makes it easier to discover where human review, physics checks, cybersecurity controls, or better instrumentation are needed.
🎓 Skills Petroleum Engineers Need to Develop
Petroleum engineers do not need to become full-time software developers to contribute in digital operations. They do need enough data literacy to ask sound questions about sources, units, missing values, assumptions, validation, and uncertainty.
Helpful capabilities include time-series analysis, basic statistics, visualization, production-system modeling, and an understanding of databases or scripting concepts. Equally valuable are communication skills: explaining a model’s limitations to management and translating a field problem for data specialists.
Domain expertise remains the anchor. Digital competence makes that expertise easier to apply at scale.
🌍 The Broader Direction of Production Operations
Future production systems will likely become more connected, more automated in routine tasks, and more integrated across wells, facilities, and emissions management. Edge computing may allow some analysis close to remote equipment, while centralized platforms support fleet-wide learning.
However, different assets will adopt different levels of digitization. A complex offshore facility, a remote unconventional pad, and a late-life conventional field have distinct economics, communications, staffing, and risk profiles.
The enduring question is not whether an asset looks technologically advanced. It is whether its people can make safer, faster, and better-supported decisions because of the digital capability.
🔑 The Core Principle: Better Decisions, Not More Data
The rise of the digital oilfield is fundamentally about decision quality. Sensors, cloud platforms, artificial intelligence, dashboards, and digital twins are tools—not the end point.
A strong system starts with trustworthy measurements, attaches engineering context, applies the right analytical method, respects operating constraints, and places results inside a workflow that people actually follow.
When those elements are present, data-driven production can help teams find losses sooner, manage equipment more deliberately, coordinate across disciplines, and learn from each operating cycle. When they are absent, even sophisticated technology can amplify confusion.
The best digital oilfield is one where data, physics, and human judgment reinforce each other in every important production decision. That is a more durable ambition than simply adding another screen to the control room. 🛢️📊⚙️