
A production report may show a single number: oil rate. Behind that number is a long pressure-and-flow path that begins thousands of metres below the rig floor and ends at a separator, storage tank, or export line. A well does not simply “make oil”; it moves a changing mixture through a connected system.
Consider an operator who sees the oil rate decline while water production rises and flowing pressure falls. Is the reservoir losing energy? Is the tubing restricting flow? Has gas broken out too early? Is the choke too tight, or is a surface separator creating backpressure? The same production symptom can have several causes.
That is why petroleum engineers think in terms of the entire production system, rather than treating the reservoir and surface facilities as separate problems. Every pressure loss, fluid-property change, and equipment setting affects what the well can deliver safely and economically.
Following the flow path from pore space to surface turns production data into a physical story. It also helps engineers choose interventions that address the real bottleneck rather than merely responding to a declining rate.
🧭 The Production System as One Pressure Path
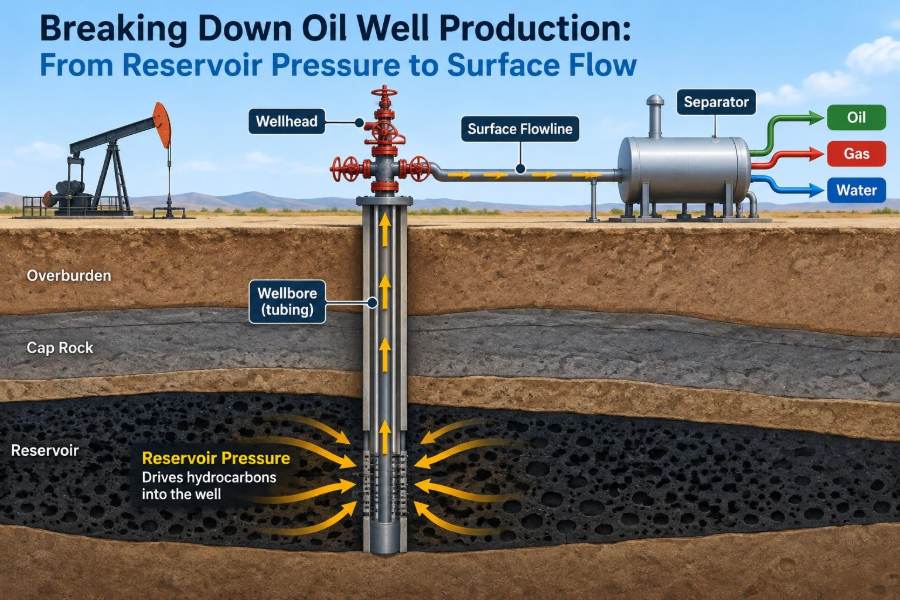
An oil well production system starts in the reservoir, where hydrocarbons occupy connected pores in rock. Fluids then flow toward the wellbore, enter through perforations, travel up the completion and tubing, pass through a wellhead choke, and move across surface piping into processing equipment.
At every stage, pressure must be high enough to overcome resistance downstream. A useful mental model is water moving from an elevated tank through a long hose with valves and bends: flow occurs because of a pressure difference, while friction and restrictions consume part of that driving force.
For a producing well, the central question is: can the pressure available at each point exceed the pressure required to move the fluid to the next point?
🪨 Where Oil Is Stored—and Where It Actually Flows
Reservoir rock is not a large underground cavern filled with oil. It is a porous solid, commonly sandstone or carbonate, whose tiny connected spaces hold oil, water, and gas. Porosity describes the volume of pore space; permeability describes how readily fluids can move through connected pores.
High porosity alone does not guarantee strong production. A rock may hold substantial fluid but have poor connectivity, making flow slow. Conversely, a highly permeable interval can deliver fluid efficiently even when its pore volume is modest.
Fluid movement also depends on relative permeability: when oil, water, and gas share the same pore network, each phase reduces the flow capacity available to the others. This is one reason rising water or gas production can change oil deliverability.
🔋 Reservoir Pressure: The Original Energy Source
Initial reservoir pressure is the starting energy that drives fluids toward a lower-pressure wellbore. It is created by the weight of overlying formations and the confined nature of reservoir fluids. Once production begins, withdrawal generally reduces average pressure unless energy is replenished.
Pressure is not necessarily uniform throughout a field. Variations can arise from depth, barriers, limited communication between rock blocks, and differing production histories. A pressure measured in one well is therefore evidence about that location and interval, not automatically a complete description of the reservoir.
Pressure data become more valuable when paired with rate, fluid samples, and well tests. Together, they help distinguish a broadly depleted reservoir from a local completion or wellbore-flow problem.
🌊 Natural Drive Mechanisms Keep Fluids Moving
Reservoirs produce through one or more natural drive mechanisms. Their relative strength affects pressure decline, gas-oil ratio, water production, and the eventual need for artificial lift or pressure support.
| Drive mechanism | How it supplies energy | Typical production implication |
|---|---|---|
| Solution-gas drive | Gas comes out of solution as pressure falls and expands. | Pressure can decline rapidly; gas handling becomes increasingly important. |
| Gas-cap drive | An initial free-gas cap expands as fluids are withdrawn. | Can provide substantial energy, but excessive gas production may reduce oil recovery efficiency. |
| Water drive | Water from an aquifer moves into the reservoir and displaces hydrocarbons. | Pressure may be better supported, while water handling can grow over time. |
| Compaction drive | Rock and connate fluids expand or compact as pressure changes. | Contribution varies strongly with rock properties and stress conditions. |
Real reservoirs often combine these mechanisms. Treating a mixed-drive reservoir as if it had one simple source of energy can lead to poor forecasts and unsuitable operating decisions.
📉 Drawdown Creates the Reason to Flow
Drawdown is the difference between reservoir pressure near the well and flowing pressure at the sandface or perforations. It is the local pressure incentive that pulls fluid from rock into the wellbore.
More drawdown can increase rate, but it is not automatically better. Excessive drawdown may mobilize fines, encourage water or gas coning, increase sanding risk in susceptible formations, or cause flow instability. The best operating point balances production rate with reservoir stewardship and completion integrity.
A low rate with ample reservoir pressure can indicate high resistance near the well. A high rate with low remaining pressure can indicate that the reservoir energy, rather than the completion, is becoming the limiting factor.
🎯 Perforations Connect Reservoir to Wellbore
In a cased-hole completion, shaped charges create perforation tunnels through casing, cement, and a short distance into the formation. These tunnels form the entry points through which reservoir fluids reach the wellbore.
Perforation performance depends on factors such as shot density, phasing, tunnel penetration, formation damage, stress, and whether the selected interval actually contains mobile oil. A completion can look mechanically sound while offering poor inflow because the perforations are plugged, poorly placed, or connected to a low-permeability zone.
Engineers evaluate this area because it is often a controllable source of pressure loss. However, adding perforations is not a universal remedy; opening additional intervals can also introduce unwanted water or gas.
🧱 Skin Is the Extra Resistance Near the Well
Skin is a dimensionless way to express additional flow resistance close to the wellbore relative to an idealized undamaged condition. Positive skin indicates impaired flow; negative skin generally indicates improved flow after stimulation or a highly conductive completion.
Common causes of positive skin include drilling-fluid invasion, scale, wax, fines migration, poor perforation cleanup, and damage caused by incompatible fluids. Because the affected zone is near the well, even a relatively thin damaged ring can have a large effect on rate.
Pressure-transient testing and production diagnostics can help identify skin, but interpretation requires care. A calculated skin value is not a direct photograph of the well; it is a model-based indication that should be checked against completion history and fluid evidence.
📈 Inflow Performance Reveals Reservoir Deliverability
An inflow performance relationship, usually shortened to IPR, describes how much a well can deliver into the wellbore at different flowing bottomhole pressures. It connects reservoir and completion behavior to a practical production-rate curve.
For a simplified single-phase oil case, the relationship can appear nearly linear: lower flowing bottomhole pressure gives greater rate. Once pressure falls below the bubble point and gas evolves, the relationship becomes more curved because multiphase flow changes the effective mobility of fluids.
IPR is not a permanent property. It changes as reservoir pressure declines, water cut changes, skin develops, and the completion is altered. Engineers should update assumptions rather than relying indefinitely on an old productivity estimate.
🫧 Bubble Point Changes the Flow Problem
The bubble-point pressure is the pressure at which gas first comes out of solution from a particular oil at reservoir temperature. Above it, the oil is undersaturated and contains no free gas. Below it, free gas may appear and alter both reservoir and wellbore flow.
Free gas can contribute expansion energy, but it can also reduce oil relative permeability near the wellbore. In the tubing, gas expansion may lower mixture density and help lift fluids, yet it can also create unstable flow and increase pressure losses under some conditions.
The practical lesson is not that gas is always helpful or harmful. Its effect depends on where it appears, how much is present, fluid properties, tubing geometry, and the pressure profile from reservoir to separator.
🧪 PVT Properties Define What the Fluids Will Do
PVT—pressure, volume, and temperature—describes how reservoir fluids change as conditions change. Laboratory fluid analysis and calibrated correlations provide properties used in production models, including oil formation volume factor, gas solubility, viscosity, density, and compressibility.
As oil rises and pressure falls, dissolved gas may evolve and the oil volume, density, and viscosity behavior can change. Temperature also falls along much of the flow path, affecting viscosity, wax risk, and emulsion behavior.
Using generic fluid properties can be acceptable for early screening, but decisions on lift design, flow assurance, and facility capacity need representative data. A sample must also be evaluated for quality: contamination or loss of light components can distort the apparent fluid behavior.
🚪 The Wellbore Is a Multiphase Flow Conduit
After entering the well, oil rarely travels alone. The tubing may carry oil, produced water, free gas, and sometimes solids. These phases do not always move at the same velocity, a phenomenon called slip.
Gas tends to rise faster than liquid; water and oil can segregate; droplets and bubbles merge or break apart. The resulting flow regime may be bubble flow, slug flow, churn flow, annular flow, or another transitional pattern. These are not just labels: each regime changes pressure drop, vibration, measurement quality, and equipment behavior.
A production engineer therefore needs a pressure model designed for multiphase flow, not a simple single-liquid pipe calculation.
⬆️ Hydrostatic Head Can Help or Hinder the Well
Hydrostatic pressure is the pressure created by the weight of the fluid column. In a vertical well, a dense liquid column imposes a large bottomhole pressure requirement. Reducing liquid density with gas can lighten the column and sometimes improve lifting performance.
This creates a counterintuitive result: a well may flow better after some gas evolves in the tubing, even though gas near the formation may harm oil mobility. Location matters.
Deviation also changes the picture. In highly deviated or horizontal sections, liquid can accumulate in low points, increasing holdup and creating intermittent flow. Elevation profile matters as much as measured depth when modelling the path to surface.
🧱 Friction Consumes Pressure Along the Way
Frictional pressure loss comes from fluid movement against tubing walls and from interactions among phases. It increases with rate, roughness, restrictions, and certain flow regimes. Scale, wax, corrosion products, and deposits can reduce effective diameter and sharply raise resistance.
Pressure loss is often separated conceptually into hydrostatic, frictional, and acceleration components. In many liquid-rich wells, hydrostatic effects dominate; in high-velocity gas-rich flow, friction and acceleration can become more significant.
This breakdown helps diagnose why a well underperforms. A tubing restriction and a heavy liquid column can produce similar surface symptoms, but require very different remedies.
🧵 Tubing Size Is a Design Trade-Off
Larger tubing lowers friction for a given liquid rate, but it may reduce gas velocity enough to worsen liquid loading in some gas-dominant wells. Smaller tubing can increase velocity and help carry liquids, while also creating more friction and limiting high-rate capacity.
There is no universally optimal tubing diameter. Selection depends on expected rates, gas-liquid ratio, fluid properties, depth, artificial-lift method, intervention constraints, and how production is expected to decline.
Changing tubing is therefore a system-design decision, not simply an attempt to “open up” the well. The appropriate size is the one that supports stable, economical operation across the anticipated range of conditions.
🔧 Artificial Lift Takes Over When Natural Energy Is Not Enough
When reservoir pressure can no longer overcome the full pressure requirement to surface, artificial lift reduces the burden on the reservoir or adds energy to the fluid column. It does not create hydrocarbons; it improves the well’s ability to produce the fluids that can enter the wellbore.
- Rod pumping uses a downhole reciprocating pump driven from surface and is common in many moderate-rate oil wells.
- Electric submersible pumps use multistage centrifugal pumps and can handle high liquid rates when conditions suit the equipment.
- Gas lift injects high-pressure gas to reduce fluid-column density and modify the pressure profile.
- Progressing cavity pumps are often selected for viscous fluids or solids-tolerant applications, subject to operating limits.
Each method has limitations involving gas, solids, temperature, deviation, power, maintenance, and operating flexibility. Lift selection should begin with reliable well and fluid data, not with equipment preference.
⚖️ Nodal Analysis Finds the Operating Point
Nodal analysis combines inflow performance with outflow performance. The inflow curve says what the reservoir can deliver at a given bottomhole pressure; the outflow curve says what pressure is required to lift a given rate through tubing, choke, flowline, and facilities.
Where the two curves intersect is the predicted operating point. If a change shifts the outflow curve downward—for example, by lowering separator pressure or improving lift—the intersection may move to a higher production rate. If skin worsens, the inflow curve shifts unfavorably and rate may decline.
This framework is powerful because it prevents isolated thinking. A stimulation, a choke change, and a facility debottleneck can all be compared by their effect on the same pressure-rate system.
🎛️ The Choke Controls Rate and Downstream Conditions
A choke is a controlled restriction at or near the wellhead. It creates a pressure drop and is used to manage production rate, protect equipment, comply with operating constraints, and avoid producing the reservoir too aggressively.
Opening a choke may increase rate, but it can also reduce flowing bottomhole pressure, raise sand-production risk, encourage coning, overload separators, or create unstable flow. Closing it can stabilize a troublesome well, though excessive restriction sacrifices potential production and increases upstream pressure.
Choke management should rely on measured pressures, rates, sand observations, fluid behavior, and defined operating envelopes. A choke setting is not merely a rate control; it affects the entire system upstream and downstream.
🚦 Critical Flow Is Not a Promise of Stable Production
When flow through a choke reaches critical, or sonic, conditions, gas velocity at the restriction reaches the speed of sound. Under appropriate conditions, downstream pressure changes have less immediate influence on the choke rate than they would in subcritical flow.
This can make wellhead control more predictable, but it does not mean the reservoir, tubing, or downstream facilities no longer matter. Upstream pressure, fluid composition, liquid content, erosion, and changing choke geometry still influence actual performance.
Engineers also watch for erosion when high-velocity fluids carry sand or droplets through restrictions. A choke that controls rate effectively can still require inspection and replacement under abrasive service.
🌡️ Temperature Drops Create Flow-Assurance Challenges
Fluids cool as they travel from the reservoir through the well and surface network. Cooling can raise oil viscosity and can promote wax deposition if temperature crosses a fluid-specific precipitation range. In certain systems, hydrates—crystalline compounds involving water and light hydrocarbons—can form at low temperature and suitable pressure.
These risks depend on fluid composition, water content, pressure, temperature history, insulation, residence time, and chemical treatment. They cannot be judged from a single temperature reading alone.
Flow assurance is proactive engineering: thermal modelling, chemical strategy, operating procedures, pigging where applicable, and contingency planning are preferable to discovering a restriction after production has stopped.
💧 Water Production Changes More Than the Water Cut
Water cut is the fraction of produced liquid that is water. A rising water cut can increase lifting requirements, corrosion exposure, emulsion-treatment needs, and disposal or reinjection demand. It can also reduce the economic value of each barrel of total liquid handled.
Water may arrive through natural aquifer support, reservoir heterogeneity, fractures, channeling behind casing, or production from an unintended interval. The cause matters. For example, a completion leak and broad reservoir water encroachment require fundamentally different responses.
Water-control decisions should be based on diagnosis, not on water cut alone. Production logs, pressure data, tracer work, well integrity information, and reservoir understanding can help identify where the water enters.
🔥 Gas Production Must Be Managed, Not Assumed Away
Produced gas affects lift, separation, compression, safety systems, metering, and emissions management. A rising gas-oil ratio may reflect solution-gas liberation, gas-cap communication, changing drawdown, a completion issue, or gas entering from a different zone.
High gas rates can reduce hydrostatic head in tubing, but excessive free gas can interfere with some pump types, create surging, and consume separator capacity. Gas handling is therefore a production constraint as well as an opportunity for fuel, sales, reinjection, or lift, depending on site configuration.
Venting or flaring practices are controlled by operational, environmental, and regulatory requirements that vary by jurisdiction and facility. Engineers must design and operate within the applicable rules rather than treat gas as a secondary by-product.
🧼 Separation Turns a Mixed Stream into Usable Products
At the surface, a separator uses gravity, residence time, and controlled pressure to split the incoming wellstream into gas, oil, and water-rich phases. The separator does not create the phases; it gives them conditions in which they can disengage sufficiently for safe downstream handling.
Pressure selection matters. Lower separator pressure can sometimes improve well deliverability by reducing backpressure, but it may increase flash gas volume and place more demand on gas handling. Higher pressure may simplify one part of the facility while restricting the upstream well.
Stable level control, appropriate residence time, and well-conditioned inlet flow support separation. Slugging, foaming, emulsions, and rapid rate changes can degrade performance and affect meter accuracy.
📏 Measurement Is the Foundation of Good Decisions
Production optimization is only as reliable as the data used to describe the system. Key measurements commonly include oil, water, and gas rates; wellhead pressures and temperatures; flowing bottomhole pressure where available; choke size; separator conditions; and artificial-lift operating data.
Allocation methods and multiphase meters can be useful, but every measurement has uncertainty. A sudden apparent rate change may come from a meter, test separator, sampling practice, or allocation adjustment rather than a physical change in the well.
Good surveillance compares measurements that should agree physically. If a reported increase in liquid rate is not reflected in separator levels, pump load, tank volumes, or associated gas behavior, the first task may be data validation.
🩺 Trend Analysis Detects Problems Before Failure
A single well test is a snapshot. Trends reveal mechanisms. Engineers look for changes in oil rate, water cut, gas-oil ratio, flowing pressures, temperature, pump intake conditions, and choke response over time.
For example, a gradual rise in tubing pressure at similar rates may suggest increasing downstream backpressure or a developing restriction. A declining liquid rate combined with changing pump behavior may indicate artificial-lift deterioration. These are hypotheses, not diagnoses, until supported by further evidence.
Useful surveillance uses consistent conditions where possible. Comparing rates at radically different choke settings, separator pressures, or lift-gas rates without normalization can create misleading conclusions.
🧰 Diagnose Bottlenecks Before Spending Capital
When output disappoints, a disciplined workflow reduces the chance of an expensive but ineffective intervention. Start by verifying data and recent operational changes, then locate the pressure loss or capacity limit.
- Confirm rates, pressures, choke position, fluid sampling, and equipment status.
- Review the well’s production history, completion schematic, and offset-well behavior.
- Compare actual performance with updated inflow and outflow expectations.
- Identify whether the likely constraint is reservoir inflow, near-wellbore damage, tubing flow, lift capacity, flowline backpressure, or facilities.
- Evaluate intervention benefits, risks, operating limits, and uncertainty before execution.
A workover may be justified for scale or mechanical failure. It will not solve a field-wide pressure decline. Likewise, a surface debottleneck cannot compensate for a well that has lost reservoir communication.
⚠️ Common Production-Optimization Mistakes
Several habits produce avoidable errors. One is maximizing short-term rate without checking sand risk, water or gas breakthrough, lift limits, and facility capacity. Another is assuming a falling rate proves reservoir depletion when restrictions or equipment faults may be responsible.
- Using stale PVT data after fluid composition or producing conditions have changed.
- Interpreting a pressure reading without confirming gauge depth, calibration, and shut-in or flowing condition.
- Changing several variables at once, making the cause of a response impossible to isolate.
- Ignoring well integrity indicators while focusing only on production targets.
- Applying a model outside the range where its assumptions are reasonable.
The remedy is not perfect certainty; field decisions rarely have it. The remedy is making uncertainty visible, testing high-value hypotheses, and monitoring results after each change.
🛡️ Integrity and Safety Are Part of Production Performance
Production flow occurs within pressure-containing barriers: casing, tubing, packers, valves, seals, wellhead equipment, pipelines, and vessels. Loss of integrity can create safety hazards, environmental releases, production losses, and misleading production behavior.
Corrosion, erosion, fatigue, scale, thermal cycling, and improper operating procedures can degrade these barriers. Monitoring programs may include pressure testing, corrosion surveillance, chemical treatment, valve maintenance, and inspection tailored to the service conditions.
Safe operating limits are not obstacles to optimization. They define the conditions under which production can continue reliably. A rate increase that exceeds a barrier, erosion, or separator limit is not sustainable production.
🌍 Responsible Operations Include Water, Gas, and Energy Use
A complete production view includes what happens to associated water, gas, chemicals, and energy after fluids reach surface. Water treatment and reinjection or disposal require compatible systems and reliable monitoring. Gas handling affects compression demand, fuel use, capture options, and emissions performance.
Reducing unnecessary pressure losses can lower compression or pumping energy, while better separation can improve product handling. Yet efficiency projects must be evaluated with process safety, reliability, and lifecycle operating constraints in mind.
Environmental performance and production performance often meet at the same engineering questions: where are fluids going, what energy is required to move them, and are containment and measurement systems functioning as intended?
🧠 A Worked Pressure-Path Thought Experiment
Imagine a hypothetical well with healthy reservoir pressure but an unexpectedly low oil rate. A test indicates that flowing bottomhole pressure is higher than anticipated, while tubing-head pressure and separator pressure are also elevated. This pattern suggests the well may be facing substantial outflow resistance.
The team might check choke condition, flowline pressure, separator control, scale history, and tubing restrictions before proposing reservoir stimulation. If lowering a verified downstream backpressure improves rate at an acceptable drawdown, the evidence supports an outflow bottleneck.
Now change the hypothetical case: downstream pressures are normal, but the well still has high bottomhole pressure and low rate. That pattern shifts attention toward inflow—perhaps skin, ineffective perforations, limited permeability, or reduced reservoir pressure. The numbers matter because they locate the problem on the flow path.
🧩 The Core Takeaway: Optimize the Whole System
Oil production is governed by a continuous balance between pressure available and pressure required. Reservoir drive supplies energy; rock and perforations control entry; multiphase flow, tubing, lift, chokes, flowlines, and facilities consume or manage that energy.
The most productive question is rarely “How do we make this well flow harder?” It is “Where is the limiting pressure loss or capacity constraint, and what change improves the system without creating a larger risk elsewhere?”
That systems mindset supports better forecasting, better lift selection, more credible interventions, safer operations, and clearer communication between reservoir, production, facilities, and integrity teams.
Successful oil-well production depends on understanding the full journey from reservoir pressure to surface flow—and managing every link in that journey as one connected system. 🛢️📈🔧