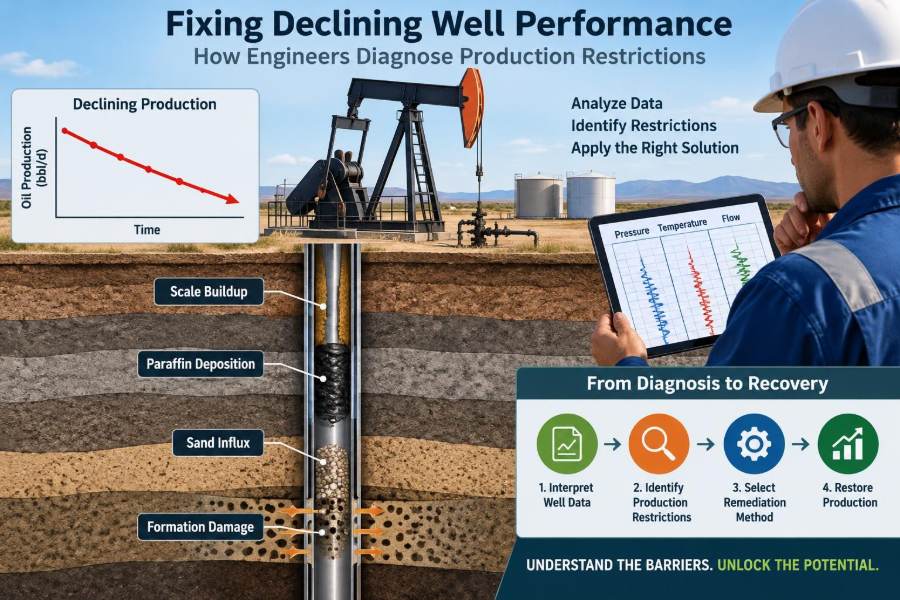

A producing well that delivered steadily for months can begin to disappoint without a dramatic failure. The daily rate falls, flowing pressure changes, water handling rises, or the well becomes unstable during routine operations. On a production report, it may look like a simple decline curve.
But a lower rate does not automatically mean the reservoir has run out of energy. The restriction may be near the wellbore, inside the completion, across a choke, or in the surface network. Each location calls for a different response, and the wrong intervention can spend money while leaving the real bottleneck untouched.
For petroleum engineers, diagnosing declining well performance is therefore a problem of structured reasoning. They compare what the well is doing now with what the reservoir, completion, artificial-lift system, and facilities should allow it to do.
The objective is not merely to restore a higher rate. It is to identify the limiting mechanism, estimate the value and risk of a remedy, and protect long-term recovery while operating safely.
🧭 Start With the Meaning of “Restriction”
A production restriction is anything that creates an avoidable pressure loss or blocks fluid movement between the reservoir and the export point. Fluids always move from higher pressure to lower pressure; a restriction consumes part of the pressure available to drive that movement.
Think of the production system as a chain: reservoir rock, perforations, wellbore, tubing, valves, flowline, separator, and export equipment. A weak link anywhere in that chain can limit the observed rate.
Some limits are intentional, such as a choke setting used to control drawdown or protect facilities. Others are unintended, including scale, wax, sand accumulation, damaged formation, or a malfunctioning gas-lift valve.
📉 Separate Natural Decline From a New Problem
Reservoir depletion commonly causes production to decline over time. As pressure falls, the driving force into the well often decreases, and fluid properties or phase behavior may also change. That background decline is expected in many fields.
A suspected restriction usually announces itself through a change from the well’s established behavior: a sharper-than-expected rate loss, a sudden pressure shift, unstable flow, rising flowing pressure at the same rate, or a response after an operational event.
The key question is not “Has the rate declined?” but “Does the current performance fit the expected reservoir and operating trend?” A well can have both depletion and a removable restriction at the same time.
🧩 View the Well as an Integrated System
Well performance is best understood as an inflow-and-outflow balance. Inflow performance describes how readily the reservoir can deliver fluids into the well. Outflow performance describes the pressure required to lift and transport those fluids to the destination.
The operating point occurs where those two relationships intersect. If inflow becomes poorer, the well produces less. If outflow becomes harder because of tubing deposits, excess backpressure, or inefficient lift, the same result can occur.
This distinction prevents a common error: treating every rate loss as a reservoir or stimulation issue when the problem may be entirely above the perforations.
🗂️ Establish a Reliable Baseline First
Diagnosis begins with data quality. Engineers assemble a baseline from periods when the well was stable, including oil, gas, and water rates; flowing tubing pressure; wellhead pressure; choke size; artificial-lift settings; fluid levels where applicable; and separator conditions.
Context matters just as much as the measurements. A rate test taken after a shut-in, separator upset, chemical treatment, or choke adjustment may not represent normal performance.
- Compare measurements taken under similar operating conditions.
- Check meter allocation, sampling, and pressure-gauge reliability.
- Record interventions, outages, and changes in nearby facilities.
- Use trends rather than relying on one unusual test point.
A precise-looking value from a poor measurement system can lead to a very confident but incorrect diagnosis.
📊 Read Rates as a Three-Phase Story
Oil rate alone rarely tells the full story. Water rate, gas rate, gas-oil ratio, water cut, and total liquid rate can reveal which part of the system has changed.
For example, declining oil with stable total liquid may indicate increasing water production rather than a physical blockage. Declining oil and liquid with rising gas fraction may point toward gas interference in a pump or changing inflow behavior. A simultaneous loss of all phases often suggests a mechanical, operational, or broad inflow issue.
Phase trends do not prove a cause by themselves, but they narrow the list of plausible mechanisms.
⏱️ Use Timing as Evidence
The onset of the decline is often one of the strongest clues. A rapid loss immediately after a workover can suggest solids, completion damage, a valve issue, or an unintended change in configuration. A gradual loss over weeks or months may fit scale deposition, wax buildup, fines migration, reservoir depletion, or a progressive lift problem.
Engineers build an event timeline around the performance change. It should include shut-ins, pressure changes, chemical programs, produced-water changes, lift-gas availability, flowline pigging, nearby offset activity, and weather-related facility constraints.
Timing establishes correlation, not proof. Still, it helps teams test the most credible explanations before selecting an intervention.
🪨 Diagnose Formation Damage Near the Wellbore
Formation damage is a reduction in permeability or effective flow capacity near the wellbore. The affected region may be small in physical size but large in consequence because fluid velocities and pressure gradients are greatest close to the well.
Common mechanisms include invasion by incompatible fluids, clay swelling, migration of fine particles, precipitates, emulsions, and residues left after drilling, completion, or treatment operations. The result is often described as elevated skin, an additional pressure drop near the wellbore.
A positive skin estimate can support the diagnosis, but it is not a unique fingerprint. Tests and interpretation must account for multiphase flow, boundaries, changing rates, and well geometry.
🎯 Check Perforations and Completion Access
Perforations connect the wellbore to the reservoir. Their effectiveness depends on shot density, penetration, orientation, cleanup, formation stress, debris, and whether the intervals actually communicate with productive rock.
Blocked or partially plugged perforations can raise the pressure required for flow. In cased-hole wells, this may result from scale, fines, corrosion products, completion debris, or poor cleanup after stimulation.
Production logging, temperature surveys, noise tools, and other diagnostics can help identify which intervals contribute flow. These tools are interpreted alongside completion drawings and rate history; no single log should be treated as a complete answer.
🧱 Recognize Scale Deposition
Scale is an inorganic mineral deposit that can form when pressure, temperature, or water chemistry changes cause dissolved ions to precipitate. It may accumulate in perforations, tubing, valves, chokes, and surface equipment.
Common warning signs include increasing pressure loss across a known restriction, declining rate at similar drawdown, reduced valve performance, and deposits recovered during cleanout. Produced-water chemistry can help assess scaling tendency, although sampling must represent the actual produced fluids.
Mechanical removal, chemical dissolvers, and inhibitor programs can be appropriate, but compatibility and placement matter. An unsuitable chemical can be ineffective or create downstream handling problems.
🕯️ Account for Wax, Asphaltenes, and Organic Deposits
Crude oils can deposit organic material when temperature, pressure, or composition changes. Wax deposition is especially associated with cooling below conditions that keep wax components dissolved, while asphaltene instability can be triggered by pressure depletion or compositional changes.
These deposits reduce the effective internal diameter of tubing and flowlines, increasing frictional pressure loss. They may also cause intermittent flow as material moves and accumulates.
Evidence may include colder sections of the system, pig returns, changing pressure gradients, or samples from a cleanout. Treatment selection should be based on fluid behavior and deposit type, not on the assumption that every dark deposit responds to the same solvent.
🏖️ Investigate Sand and Solids Loading
Sand production can erode chokes and valves, fill low points, bridge across restrictions, damage pumps, and create a serious well-control or integrity concern in severe cases. Other solids, such as proppant flowback, corrosion products, or formation fines, can create similar operational symptoms.
A well may still show good reservoir inflow while failing to lift solids out of the wellbore. Low velocity, repeated shut-ins, changing water cut, or unstable flow can encourage accumulation.
Before increasing drawdown to “blow the well clean,” engineers evaluate sanding risk. More aggressive production may temporarily raise rate while worsening formation failure, erosion, or disposal demands.
🚰 Examine Water Effects Beyond Water Cut
Rising water production can reduce oil output by changing relative permeability, increasing hydrostatic head, and overloading pumps or surface equipment. It can also bring scale-forming ions and accelerate corrosion.
Water breakthrough does not always mean the reservoir is uniformly swept. It may reflect a high-permeability streak, fracture communication, coning, channeling behind pipe, or flow from an unintended interval.
Diagnostic work may involve production logs, tracer information where available, pressure behavior, completion review, and reservoir context. Water shutoff can be valuable in selected cases, but treating the wrong pathway can damage productive intervals.
💨 Understand Gas Interference and Gas Locking
Free gas can reduce the efficiency of many artificial-lift systems. In rod-pumped wells, gas interference can reduce pump fillage. In electric submersible pumps, gas can cause surging, loss of head, vibration, and unstable operation. In gas-lift wells, changing injection or production conditions can alter the unloading and operating behavior.
A rising gas-oil ratio may be a reservoir signal, but it may also expose a lifting limitation. The diagnosis needs pressures, fluid properties, pump or valve data, and an understanding of where gas enters the wellbore.
Possible responses include changing intake conditions, improving gas separation, modifying pump design, adjusting gas lift, or managing drawdown. Each option has operating limits and should be evaluated for the specific well.
⚙️ Test Artificial-Lift Performance
Artificial lift does not create reservoir inflow; it lowers bottomhole flowing pressure or transports fluids more effectively so the reservoir can deliver more. A lift problem can therefore resemble a formation problem on a simple rate chart.
For rod pumps, engineers review dynamometer cards, pump fillage, fluid level, stroke rate, loads, tubing movement, and leakage indicators. For ESPs, they assess intake and discharge pressure, motor load, frequency, temperature, vibration, and operating position on the pump curve.
For gas lift, injection pressure and rate, valve operation, casing pressure, and available injection-gas supply are central. A system model should be updated with measured data rather than relying only on original design assumptions.
🔩 Inspect Tubing, Valves, and Downhole Hardware
Mechanical restrictions can be simple but consequential: a partially closed sliding sleeve, a failed safety valve, a leaking or plugged gas-lift valve, damaged tubing, a shifted packer, or debris lodged in the completion.
Pressure tests, caliper surveys, drift runs, wireline tools, and workover findings can provide evidence, depending on the completion and operating risk. A pressure response inconsistent with expected friction losses may justify a focused mechanical investigation.
Hardware diagnosis must also consider integrity. A suspected leak, corroded barrier, or pressure-containing component failure changes the priority from production optimization to safe containment and verification.
🌡️ Use Pressure and Temperature Surveys Wisely
Pressure surveys show where energy is being consumed. Temperature surveys can reveal fluid entry, gas expansion, leaks, crossflow, and active intervals because flowing fluids and phase changes alter the thermal profile.
Static measurements and flowing measurements answer different questions. A buildup test may provide reservoir information, while a flowing gradient survey can expose excessive hydrostatic or frictional losses in the wellbore.
Survey interpretation is not automatic. Gauge depth, stabilization time, multiphase flow, tool accuracy, and changing rates all influence confidence in the result.
📐 Build and Challenge the Nodal Analysis
Nodal analysis represents pressure losses from the reservoir to the sales point and compares inflow performance with vertical-lift and surface-system requirements. It is a practical framework for locating the segment that limits production.
A model is only as good as its inputs. Fluid properties, water cut, gas fraction, tubing dimensions, roughness, true vertical depth, choke behavior, separator pressure, and lift performance should be checked against field data.
Use the model to ask bounded questions: What happens if tubing is cleaned? What rate is feasible at lower separator pressure? Would a larger pump move the operating point, or is inflow already limiting? Those scenarios guide data collection as well as design.
🚧 Do Not Ignore Surface Backpressure
A well may be healthy downhole but constrained by a high-pressure separator, undersized flowline, fouled heat exchanger, partially plugged pipeline, closed control valve, or shared facility bottleneck. This is especially relevant when several wells decline together.
Comparing wellhead pressure, downstream pressure, and pressure drop across individual equipment can reveal where backpressure has increased. Changes in routing or test-separator conditions can also affect apparent well performance.
Reducing surface backpressure may increase production, but it must remain within facility capacity, process-control limits, emissions requirements, and safe operating envelopes.
🛑 Treat Choke Changes as Controlled Experiments
A choke controls flow by imposing a deliberate pressure drop. Opening it may raise rate, but it can also increase drawdown, sanding, water or gas coning, slugging, hydrate risk, and erosion. A larger choke is not automatically a better choke.
When conditions allow, a documented choke test can be a useful diagnostic experiment. Hold enough variables steady, measure stabilized rates and pressures, and define beforehand what outcome would support or reject a hypothesis.
Tests should be planned with operations and process safety personnel. A response at the surface does not necessarily show that the reservoir will behave favorably over the longer term.
🧪 Design Samples and Fluids Tests for the Decision
Fluid samples are most valuable when tied to a specific decision. Water analysis may support a scale-management plan; oil characterization may inform wax or asphaltene treatment; solids samples can distinguish formation sand from corrosion debris or proppant.
Sampling errors are easy to introduce. A sample from a separator may not represent downhole conditions, and contamination, flashing, or poor preservation can alter the result.
Ask what uncertainty the sample will reduce and whether the collection method can answer it. A carefully targeted sample is often more useful than a large set of unconnected laboratory results.
🧾 Rank Hypotheses Instead of Guessing
After reviewing trends and diagnostics, engineers create a ranked list of possible causes. Each hypothesis should state the expected evidence, conflicting evidence, test required, likely remedy, cost, production upside, and operational risk.
| Observed pattern | Plausible causes | Useful next checks |
|---|---|---|
| Rate loss with higher tubing pressure | Tubing restriction, surface backpressure, choke issue | Pressure gradient, equipment pressure drops, deposit evidence |
| Rate loss with lower bottomhole pressure | Weaker inflow, formation damage, depletion | Inflow analysis, pressure transient data, completion review |
| Erratic rate and pressure | Gas interference, slugging, unstable lift, solids movement | High-frequency trends, lift diagnostics, flow regime review |
| Oil loss with rising water | Water breakthrough, coning, pump overload | Production log, reservoir context, pump operating data |
The table is a screening tool, not a diagnostic rulebook. Several causes can produce the same pattern, particularly in multiphase wells.
🔍 Choose the Least-Invasive High-Value Test
The best next action is not always the most sophisticated one. First confirm simple facts: valve lineups, choke position, gauge status, chemical-injection availability, lift-gas allocation, and separator pressure.
Then select a test that most efficiently distinguishes between leading hypotheses. A pressure survey may be more valuable than an immediate stimulation, while a production log may be justified before an expensive water shutoff.
This approach reduces intervention risk. Every downhole operation can introduce new uncertainty, damage equipment, or temporarily interrupt production.
🧰 Match the Remedy to the Mechanism
A successful remedy addresses the physical constraint. Scale may call for removal and inhibition; wax may require thermal, mechanical, or chemical management; a failing pump may need optimization or replacement; high backpressure may need facility changes; formation damage may justify carefully designed stimulation.
Some actions improve access to existing reserves but do not change reservoir energy. Others increase drawdown and can accelerate water or gas production. The expected benefit should be expressed as a range with assumptions, not as a promise.
Post-job surveillance is part of the remedy. If a treatment works only briefly, the team needs to determine whether the mechanism recurred, placement was incomplete, or the original diagnosis was wrong.
💰 Evaluate Economics Alongside Technical Merit
A technically credible intervention may still be a poor choice if it requires long downtime, has low probability of success, creates costly disposal, or risks damaging a well near the end of its economic life. Conversely, a modest pressure-loss reduction can be highly attractive when it is low-risk and repeatable.
Decision-making should consider incremental production, operating cost, intervention cost, deferred production, failure consequences, facility constraints, and uncertainty. Scenario ranges are more honest and more useful than one deterministic forecast.
Economic screening should never override a barrier, integrity, or environmental concern. Those risks require appropriate controls before optimization continues.
🦺 Put Safety, Integrity, and Environment First
Restriction diagnosis can involve pressure changes, chemical handling, wireline operations, solids, hydrocarbons, and produced water. Each activity needs site-specific procedures, competent personnel, and clear authority to stop work when conditions are unsafe.
Opening a choke, circulating chemicals, or displacing fluids may affect pressure containment, flare loads, emissions, corrosion, and waste handling. A production gain does not justify bypassing management-of-change or well-integrity requirements.
Engineers should communicate operational limits directly in their recommendations: maximum pressures, chemical compatibility conditions, sand-production triggers, required monitoring, and criteria for suspending the test.
⚠️ Avoid Common Diagnostic Traps
- Changing many variables at once: the result cannot identify what caused the response.
- Trusting unverified allocation data: a test separator or meter issue can mimic a decline.
- Interpreting a short-term rate spike as success: cleanup, stored fluids, or transient drawdown can distort early results.
- Assuming one mechanism: a scaled tubing string and declining reservoir pressure can coexist.
- Using a model as proof: models organize assumptions; they do not replace measurement.
Good diagnosis is often less about a brilliant single insight than about systematically ruling out attractive but weak explanations.
🔁 Turn Each Well Into a Learning System
Capture the before-and-after record for every intervention: symptoms, suspected cause, data used, treatment details, immediate response, sustained response, unexpected effects, and lessons for similar wells. This creates field-specific knowledge that generic workflows cannot provide.
Over time, recurring patterns may justify preventive programs such as scale inhibition, wax surveillance, routine lift optimization, corrosion monitoring, or facility debottlenecking. Prevention is most effective when based on observed mechanisms rather than calendar-driven habit.
Clear handover between production, reservoir, facilities, chemistry, and operations teams is essential. Production restrictions commonly cross disciplinary boundaries.
🧠 A Practical Diagnostic Sequence
- Verify rates, pressures, and operating configuration.
- Compare the current condition with a stable baseline and expected decline.
- Build a timeline of events and changes around the onset.
- Separate likely inflow limits from outflow and lift limits.
- Rank hypotheses using all phase behavior, pressure, and operational evidence.
- Select the least-invasive test that meaningfully reduces uncertainty.
- Design the remedy with production, integrity, safety, and economics in view.
- Measure the sustained outcome and update the well model.
This sequence is deliberately iterative. New measurements may overturn the first interpretation, and that is a sign that the process is working.
🏁 The Core Principle: Find the Pressure Loss That Matters
Declining well performance is rarely solved by treating the rate as the diagnosis. Rate is an outcome of reservoir deliverability, wellbore flow, artificial lift, and surface backpressure acting together.
The strongest engineering decisions identify where the meaningful pressure loss or flow impairment occurs, verify that conclusion with proportionate evidence, and apply the narrowest effective remedy. This avoids unnecessary interventions and makes production improvements more durable.
When uncertainty remains, it should be stated plainly. A disciplined test with a clear decision rule is usually better than an expensive attempt to fix every possible cause at once.
The most reliable way to restore a declining well is to diagnose the whole production system, then remove the restriction that evidence—not assumption—shows is controlling performance. 🛢️📈🔧