
A production forecast can shape decisions worth millions: whether to drill an infill well, expand water handling, defer a compressor, or revise reserves. Yet anyone who has compared an early forecast with actual field performance knows the uncomfortable truth: the subsurface does not read the plan.
Modern reservoir simulation gives engineers a remarkable way to test future development choices before committing rigs, pipelines, and capital. A digital model can represent wells, rock layers, fluids, pressure changes, and operating constraints across decades of production.
That capability is powerful—but it is not a crystal ball. A simulator calculates the consequences of assumptions, and the quality of its forecast depends heavily on what is known, what is uncertain, and how honestly that uncertainty is handled.
Understanding both the strength and the limits of reservoir simulation is essential for students entering the field and professionals making decisions with imperfect data.
🧭 What a Reservoir Simulation Actually Does
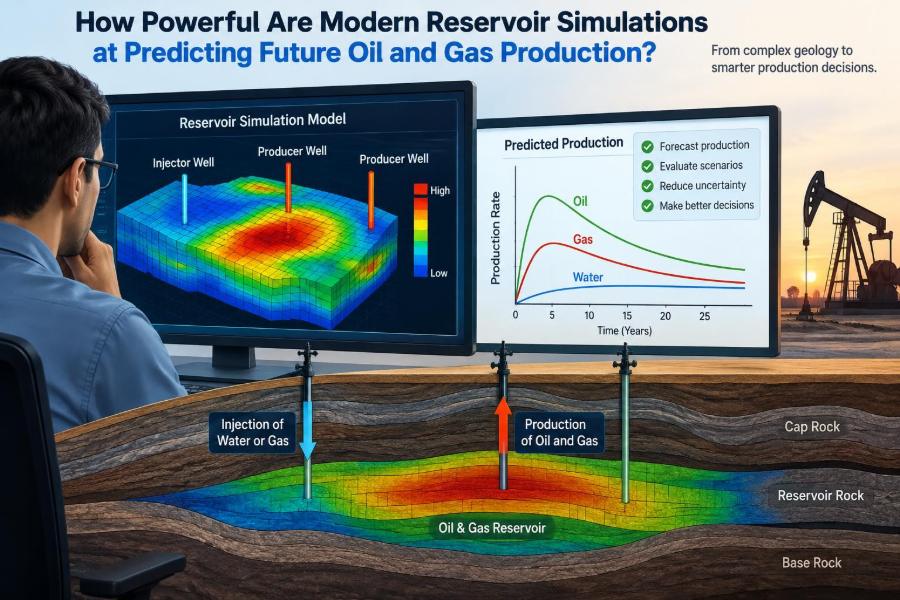
A reservoir simulator is a numerical model that approximates fluid flow through porous rock. It divides a reservoir into many connected grid cells and solves conservation equations for mass and, depending on the model, energy.
For every time step, the model estimates pressure, phase behavior, saturation, flow between cells, and well production or injection. The result is not “the future”; it is a physically constrained scenario generated from specified inputs.
🧱 Why the Reservoir Cannot Be Seen Directly
Engineers infer reservoir properties from sparse evidence: seismic interpretation, well logs, cores, pressure tests, fluid samples, and production history. A field may extend over many square kilometers, while direct rock measurements come from a limited number of wellbores.
Between wells, continuity of sand bodies, faults, fractures, permeability streaks, and fluid contacts must be interpreted. This gap between what is measured and what is represented is the fundamental source of forecast uncertainty.
🗺️ The Grid Is a Practical Approximation
Simulation grids convert a complex geological volume into manageable cells. Finer cells can describe thin layers, faults, and near-well flow more accurately, but they also increase runtime and data-management demands.
Coarser grids may smooth out barriers or high-permeability channels that strongly affect water breakthrough. Good model design uses detail where it changes decisions, rather than pursuing maximum resolution everywhere.
🪨 Static Models Supply the Geological Framework
A static geological model describes structure, stratigraphy, facies, porosity, net-to-gross ratio, and permeability distribution. It is the starting point for a dynamic flow model, but it is not automatically suitable for simulation.
Upscaling converts fine-scale geological properties to simulation-scale properties. Done poorly, it can alter flow capacity or vertical communication; done thoughtfully, it preserves the features most relevant to recovery and well performance.
💧 Fluids Behave Differently Under Reservoir Conditions
Oil, gas, and water share pore space and respond to pressure and temperature. Their properties—density, viscosity, compressibility, formation volume factor, and gas-oil ratio—change as conditions change.
Fluid characterization commonly relies on pressure-volume-temperature, or PVT, data. If PVT behavior is poorly represented, even an excellent geological model can produce misleading pressure decline, gas liberation, or surface-volume forecasts.
🧪 Relative Permeability Controls Who Can Flow
Relative permeability describes how easily each phase flows when other phases are present. Water may occupy part of the pore space without flowing much at first; once its saturation rises, its mobility can increase rapidly.
This relationship helps determine water cut, gas breakthrough, recovery efficiency, and the response to injection. Laboratory measurements are valuable, but scale, wettability, rock type, and hysteresis mean they must be applied with engineering judgment.
⚙️ Capillary Pressure Shapes Fluid Distribution
Capillary pressure arises from fluid interfaces in small pores and influences where oil, gas, and water reside before and during production. It is particularly relevant in transition zones and in rocks with fine pore throats.
Ignoring capillary behavior can make initial saturations unrealistically sharp or distort movement between layers. Its effect is not equally important in every reservoir, so model complexity should match the decision being evaluated.
🕳️ Wells Are More Than Points on a Map
A well model includes perforated intervals, completion design, skin, wellbore pressure losses, operating controls, and sometimes artificial lift or surface constraints. Horizontal wells and multistage fractured wells require additional care because contact area and flow pathways are very different from those of vertical wells.
If well controls are unrealistic, the model may match historical volumes for the wrong reason. A forecast should represent how the asset can actually be operated, not merely how it would perform with unlimited drawdown.
📈 History Matching Tests the Model Against Reality
History matching adjusts uncertain model inputs until simulated behavior is consistent with observed production rates, water cut, gas-oil ratio, pressures, and other surveillance data. It is an iterative calibration process, not a one-time tuning exercise.
A useful match captures several independent observations, not just total field oil. Matching cumulative production while missing pressure or water arrival may hide an incorrect understanding of drive mechanism or connectivity.
🔍 A Good Match Is Not Proof of a Unique Answer
Many combinations of permeability, fault transmissibility, aquifer strength, relative permeability, and well skin can reproduce similar historical production. This is called non-uniqueness.
Therefore, a history-matched model is best viewed as one plausible explanation, or one member of a plausible set. Treating a single matched realization as proven geology is a common and costly mistake.
🎯 Prediction Depends on What Has Been Observed
Forecast confidence generally improves when the model has been tested by relevant field behavior. A mature waterflood with pressure surveys, tracer information, and production allocation data provides more constraints than a newly discovered field with one short production test.
Confidence also varies by question. Near-term production from an existing well may be more predictable than ultimate recovery from an untested sector or the result of a new enhanced oil recovery process.
⏳ Short-Term and Long-Term Forecasts Are Different
Short-term forecasts are often dominated by known operating conditions: current choke settings, downtime assumptions, facility capacity, and recent well behavior. They can still be wrong, but their uncertainty may be narrower.
Long-term forecasts accumulate uncertainties in reservoir response, well interventions, pressure support, economics-driven operating choices, and future drilling schedules. A smooth twenty-year production curve can conceal a very wide range of plausible outcomes.
🌊 Water Breakthrough Is Often Hard to Predict
Water movement is sensitive to permeability contrasts, fractures, completion intervals, coning, behind-pipe communication, and injector-producer connectivity. Small errors in any of these can shift breakthrough timing substantially.
When water handling capacity is a key decision, teams should examine a range of water scenarios rather than relying on one predicted breakthrough date. The operational impact of early water can exceed the impact of a modest oil-rate difference.
💨 Gas Reservoirs Bring Their Own Challenges
Gas forecasts can be sensitive to condensate dropout, changing deliverability, non-Darcy flow near wells, water influx, compression limits, and abandonment pressure. In gas-condensate reservoirs, liquid banking near the wellbore can further reduce gas productivity.
Compositional simulation may be needed when phase behavior materially affects the decision. Simpler black-oil models are efficient and useful in many cases, but they do not represent every fluid system adequately.
🔗 Faults and Connectivity Can Change Everything
A mapped fault may seal, partially seal, or transmit flow. Likewise, apparent layers may communicate through windows, fractures, or bypassed channels that are not evident in sparse well data.
Connectivity determines pressure support, sweep, compartment depletion, and whether an injector benefits a nearby producer. Because it is often uncertain, it deserves explicit scenario testing rather than a single assumed transmissibility value.
🧠 Physics Matters, but So Do Operating Assumptions
A reservoir model may faithfully solve flow equations and still provide an impractical forecast if its development assumptions are weak. Drilling dates, facility limits, injection-water availability, compression, workover success, and uptime all affect actual production.
Integrated asset forecasting connects reservoir behavior with wells, networks, facilities, and operations. The reservoir is one part of a production system, not an isolated underground machine.
📊 Deterministic Cases Answer “What If?”
A deterministic simulation uses one selected set of inputs to answer a defined question. For example: What happens if two horizontal producers are drilled in the northern block next year under a specified pressure constraint?
These cases are excellent for comparing development concepts, locating sensitivities, and understanding mechanisms. Their limitation is that a single result can look more certain than the assumptions justify.
🎲 Uncertainty Workflows Show a Range of Futures
Probabilistic workflows vary uncertain inputs across multiple realizations or scenarios. The output is a distribution of possible production profiles, recoveries, water volumes, or economic indicators rather than one curve.
Not every uncertainty needs to be varied. The most useful studies focus on uncertainties that are both plausible and decision-relevant, such as connectivity, aquifer support, well productivity, or fracture behavior.
📉 P10, P50, and P90 Need Careful Interpretation
These labels are often used to summarize forecast distributions, but their meaning depends on the quantity and convention being reported. In a common reserves-style convention, P90 is a conservative high-confidence volume and P10 is an optimistic volume.
They should not be treated as three complete, internally consistent reservoir models or as guaranteed outcomes. The assumptions, dependencies, and aggregation method behind the percentile matter as much as the label.
🧮 Faster Models Do Not Automatically Mean Better Decisions
Full-physics simulation can be computationally intensive, especially for compositional models, unstructured grids, or large uncertainty ensembles. Proxy models, streamline methods, reduced-order models, and machine-learning surrogates can accelerate screening.
Speed is valuable when it enables wider uncertainty exploration. However, a fast approximation must be validated against an appropriate higher-fidelity model and should not be used beyond the range where it was trained or tested.
🤖 Machine Learning Complements Rather Than Replaces Physics
Machine learning can identify patterns in production data, estimate proxy relationships, assist with optimization, and speed repetitive calculations. It is particularly useful when many simulation runs are needed for uncertainty analysis or control optimization.
But data-driven models can inherit bias from incomplete data and may fail when field conditions change. Physics-based simulation remains essential when extrapolating beyond observed behavior or explaining why a response is plausible.
🛰️ Surveillance Turns Forecasting into a Learning Loop
Pressure surveys, production logging, tracer tests, saturation monitoring, interference tests, permanent gauges, and 4D seismic can reduce selected uncertainties. No surveillance method is universally decisive; each has resolution limits, cost, and interpretation uncertainty.
The value of surveillance lies in asking a focused question first: which measurement could change a major decision? Data that distinguish between competing connectivity or sweep hypotheses can be far more valuable than data collected without a decision context.
🔄 Model Updating Should Be Disciplined
New data should trigger a structured review of model assumptions, not an automatic adjustment to force agreement. Engineers should check data quality, allocation changes, operating events, and whether the observation is truly inconsistent with the prior model.
Version control, documented assumptions, and reproducible workflows help teams understand why forecasts changed. A model that evolves transparently is more useful than one that appears to improve while its logic becomes impossible to trace.
🚧 Common Ways Forecasts Go Wrong
Forecast failures often arise less from numerical errors than from hidden assumptions. Typical problems include:
- Using a history match that reproduces rates but ignores pressure, water cut, or completion changes.
- Assuming wells will deliver ideal productivity despite mechanical, drawdown, or facility constraints.
- Reporting a base case without credible low and high cases.
- Extending local geological trends far beyond available control.
- Confusing calculated precision with physical certainty.
These issues can be reduced through peer review, independent checks, and clear communication of assumptions.
🧰 Fit the Model to the Decision
The right model is not always the most detailed one. A screening decision on broad development spacing may need a fast, calibrated sector or full-field model with uncertainty ranges. A decision about perforating a specific interval may require finer near-well detail and stronger completion data.
Ask three questions: What decision is being made? What uncertainty could change it? What model fidelity is sufficient to distinguish the alternatives? This keeps simulation effort proportional to value.
🏗️ Example: Comparing Two Waterflood Plans
Consider a hypothetical oil field with uneven reservoir quality and uncertain fault communication. One plan adds injectors early to maintain pressure; another delays injection and prioritizes producers in the best-quality area.
A simulation study can compare oil rate, cumulative recovery, injection demand, water production, pressure distribution, and sensitivity to fault sealing. It cannot establish which plan will succeed with certainty, but it can show which assumptions cause the plans to diverge and where surveillance could reduce the decision risk.
💼 Simulation Supports Decisions, Not Just Reserves Booking
Reservoir simulation is used for development planning, well placement, injection strategy, facility sizing, enhanced recovery design, abandonment planning, and emissions-related operational choices such as minimizing unnecessary compression or water movement.
Its greatest value often comes from avoiding poor decisions early. Demonstrating that a proposed well is highly sensitive to an untested barrier can justify appraisal or surveillance before capital is committed.
🗣️ Communicating Forecasts Without False Confidence
Decision-makers need a clear recommendation, but they also need to know what could overturn it. Effective communication separates known facts, calibrated inferences, assumptions, and unresolved uncertainties.
Show production ranges alongside the base case, explain major drivers, and describe operational consequences. “Earlier water arrival would require additional handling capacity” is more actionable than simply presenting a wider uncertainty band.
🎓 Skills That Make Simulation Engineers More Effective
Strong simulation work combines several disciplines. Numerical skill alone is not enough; engineers need geological reasoning, fluid-flow fundamentals, production knowledge, data-quality awareness, and the ability to communicate uncertainty.
- Understand the physical meaning behind every major input.
- Challenge whether a history match is mechanistically credible.
- Use simple calculations to sanity-check simulation output.
- Learn enough coding and data handling to make workflows repeatable.
- Discuss assumptions openly with geoscientists, production engineers, and operations teams.
⚖️ So, How Powerful Are Modern Reservoir Simulations?
Modern reservoir simulations are among the most powerful decision tools in petroleum engineering because they connect geology, fluids, wells, and operations in a single dynamic framework. They can reveal interactions that simple decline curves or static maps cannot capture.
Their power is conditional. A model is reliable only to the extent that its data, physics, calibration, operating assumptions, and uncertainty treatment are appropriate for the decision. The most credible forecast is rarely the most precise-looking curve; it is the one that clearly explains what could happen, why, and what evidence would change the view.
Reservoir simulation is most valuable not when it claims to predict one exact future, but when it helps engineers make robust choices across several plausible futures. Used that way, it turns uncertainty from an embarrassment to hide into a risk to understand and manage. 🛢️📊🔍