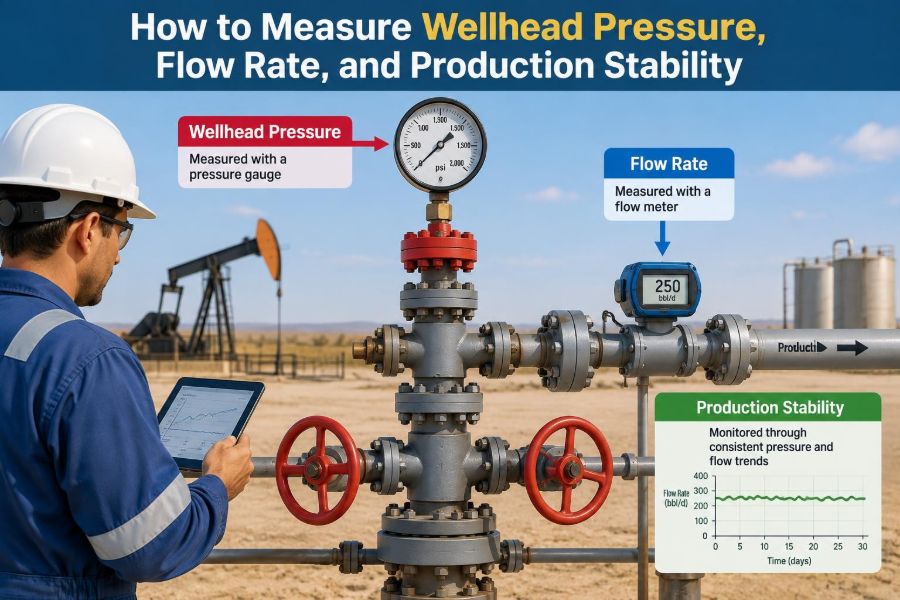

A well may look calm at the surface while its production behavior is changing underneath. A small pressure decline, an erratic rate, or a growing water cut can be an early clue that the reservoir, tubing, choke, separator, or measurement system needs attention.
On a busy production location, operators need answers quickly: Is the well actually losing productivity? Is the choke setting responsible? Did a gauge drift, or has liquid loading begun? Reliable measurements turn those questions from guesses into an engineering workflow.
Wellhead pressure, flow rate, and production stability are closely connected, but they are not interchangeable. Reading one number correctly requires knowing where it was measured, when it was measured, and what operating conditions existed at that moment.
This guide explains how these measurements are obtained, checked, interpreted, and used together to support safer, more informed production decisions.
🧭 Start with the Measurement Objective
Before selecting an instrument or opening a data screen, define the decision the measurement must support. A routine production allocation, a choke optimization exercise, and a suspected well-integrity investigation need different accuracy, frequency, and safety controls.
A useful question is: what change would alter the operating decision? If a small pressure difference could lead to a choke adjustment, the measurement uncertainty must be understood. If the goal is simply to identify a major loss of production, a lower-resolution trend may be sufficient.
🏗️ Understand the Surface Flow Path
Fluids travel from the reservoir through the completion and tubing, across the wellhead and production tree, through a choke, and into a flowline or test separator. Pressure is lost along this path because of elevation, friction, restrictions, and phase changes.
Knowing the flow path prevents a common error: comparing pressures taken at different locations as if they represent the same condition. A tubing-head pressure and a downstream flowline pressure can both be valid, yet answer different engineering questions.
📍 Define Wellhead Pressure Precisely
Wellhead pressure is the pressure measured at a specified point on the surface well equipment. In practice, the term can refer to tubing-head pressure, casing-head pressure, or pressure upstream or downstream of the production choke. The exact location must always be recorded.
For a flowing producer, tubing-head pressure is often especially useful because it reflects the backpressure the well sees at the top of the tubing. Casing pressure can provide additional clues about annular communication, gas lift performance, or well-integrity concerns, depending on the completion design.
🎯 Identify the Correct Pressure Tap
A pressure instrument should be connected to a designated, accessible pressure tap that represents the intended process point. The tap must be isolated safely, free of leaks, and positioned so trapped liquid, wax, scale, or debris does not distort the reading.
Pressure taps near a choke or elbow deserve particular care. Turbulence and rapid pressure changes can make local readings unrepresentative. For troubleshooting, record the point using clear language such as “upstream choke pressure” rather than the vague label “wellhead pressure.”
🧰 Choose a Suitable Pressure Instrument
Common options include mechanical gauges, digital pressure gauges, pressure transmitters tied to a control system, and temporary data loggers. Each can be useful when its range, accuracy, service rating, and installation condition match the job.
| Instrument | Useful application | Key limitation |
|---|---|---|
| Mechanical gauge | Simple local indication and field checks | Can suffer from vibration, parallax, or calibration drift |
| Digital gauge | Spot checks and diagnostic work | Requires correct range, battery condition, and zero check |
| Pressure transmitter | Continuous monitoring and automated trending | Needs calibration management and signal validation |
| Data logger | Capturing pressure behavior over time | Installation and time synchronization matter greatly |
✅ Check Range, Calibration, and Zero
A gauge should not be selected merely because it fits the connection. Its full-scale range should cover expected operating pressure without placing normal readings too close to zero or full scale, where practical resolution can suffer.
Confirm that the instrument has a current calibration status under the site’s quality system. Before use, inspect it for damage and verify its zero reading where the procedure allows. A stable-looking value is not automatically a trustworthy value.
🦺 Treat Pressure Measurement as a Safety Task
Connecting or removing a pressure gauge exposes personnel to stored energy and potentially hazardous hydrocarbons. The work must follow the site’s permit, isolation, depressurization, personal protective equipment, and gas-testing requirements.
Never assume that a valve isolates perfectly. Verify the arrangement, use rated fittings and hoses, stand clear of likely release paths, and avoid improvising connections. Measurement quality is meaningless if the method introduces an uncontrolled release or injury risk.
🕒 Capture the Operating Context
A pressure reading without context has limited value. Record the timestamp, well status, choke setting, artificial-lift status, separator conditions, flowline routing, shut-in history, and any active chemical or cleanup operation.
For example, a tubing-head pressure taken immediately after a choke change is not directly comparable with a stabilized reading taken several hours later. Context turns isolated readings into traceable operating data.
🔧 Read the Choke and Its Position
The choke is a deliberate restriction used to control flow and manage wellhead and downstream pressure. A choke setting may be expressed as a bean size, a percentage opening, or a position value, depending on equipment type.
Do not assume that identical settings create identical restrictions across different choke designs. Erosion, plugging, trim geometry, and actuator calibration can change actual flow behavior. Record the choke type and setting together, especially during well tests.
🌊 Recognize Multiphase Flow Effects
Most producing wells do not deliver a single, uniform liquid. Oil, gas, water, and sometimes solids travel together, often in changing flow patterns. Slugs of liquid and gas can cause pressure and rate readings to oscillate even when average production is relatively steady.
This is why a single instantaneous meter reading can be misleading. Multiphase behavior is a physical feature of the system, not necessarily an instrument failure. Good practice distinguishes short-term fluctuation from a meaningful change in average performance.
📏 Define Flow Rate Before Measuring It
“Flow rate” should state both the fluid and the basis of measurement. Oil rate, water rate, gas rate, total liquid rate, and total mass rate describe different things. Gas rates also need a stated reference basis because gas volume changes strongly with pressure and temperature.
For production work, common reporting terms include stock-tank oil rate, produced-water rate, and gas rate at standard or base conditions. The applicable company or regulatory basis should be used consistently; mixing bases can create false production changes.
🧪 Use a Test Separator for Direct Phase Rates
A test separator separates a wellstream into gas and liquid sufficiently to measure individual phase flows. It is widely used for periodic well tests because it gives a practical reference point for oil, water, gas, pressure, and temperature.
Testing requires enough time for the separator and the well to stabilize. If the liquid level is still cycling strongly or the well is unloading after a routing change, the resulting rates may reflect the transition rather than representative production.
📡 Understand Multiphase Flow Meters
Multiphase flow meters estimate phase rates without fully separating the stream. They can be valuable where frequent tests, space constraints, subsea locations, or remote operations make test separation difficult.
However, their outputs depend on meter design, fluid-property assumptions, flow regime, water salinity, gas volume fraction, and calibration or verification practices. They provide useful operational data, but they should not be treated as infallible under every fluid condition.
🧮 Convert Raw Meter Data Carefully
Many meters measure a primary signal rather than rate directly. Differential-pressure devices infer flow from the pressure drop across a restriction; turbine and positive-displacement meters respond to movement; Coriolis meters measure mass flow and density-related behavior.
Conversion requires correct inputs for pressure, temperature, density, meter factor, and fluid properties. A spreadsheet can calculate a rate correctly and still produce the wrong answer if an upstream pressure transmitter, temperature signal, or fluid assumption is wrong.
🌡️ Correct Gas Volumes to a Common Basis
Gas occupies more volume at low pressure and high temperature than at high pressure and low temperature. Therefore, an actual volumetric reading at the meter must be corrected to an agreed base condition before it can be compared with other gas volumes.
The correction uses measured pressure and temperature along with a compressibility factor, often called the Z-factor. The precise calculation method depends on the applicable measurement standard and gas composition information. Consistent bases matter more than casual comparisons of uncorrected volume.
💧 Separate Oil, Water, and Emulsion Questions
A liquid meter may accurately measure total liquid while still leaving uncertainty about how much is oil and how much is water. Water cut—the water fraction of the liquid stream—must be measured or estimated using representative sampling, online analyzers, or test-separator methods.
Emulsions complicate the picture because oil and water may not separate cleanly. Sampling location, mixing, chemical treatment, and sample handling can all affect the reported water cut. A surprising water increase should prompt verification before major reservoir conclusions are made.
📊 Calculate Production Rates Over a Defensible Period
Rate is volume divided by time, but the selected time window matters. A short interval may capture a slug, a separator level correction, or a temporary process upset. A longer interval smooths noise but can hide real changes.
Choose an averaging period that matches the decision. Operators may need minute-by-minute trends for troubleshooting, while allocation and reservoir surveillance often rely on stabilized test periods or daily totals. Always note downtime and curtailment rather than silently treating them as low reservoir productivity.
📈 Define Production Stability
Production stability means that key operating variables remain within an expected range under essentially unchanged conditions. It does not mean the rate never moves. Every well has some natural variability, particularly under multiphase flow.
A stable well usually shows repeatable average rates, manageable pressure variation, consistent choke response, and no unexplained trend in water cut, gas-liquid ratio, or separator behavior. Stability is best evaluated as a pattern across several variables, not a single flat line.
〰️ Use Trends Instead of Isolated Snapshots
Trend plots reveal relationships that individual readings conceal. Plot tubing-head pressure, choke setting, oil rate, water rate, gas rate, flowline pressure, and operating events on aligned time axes whenever possible.
If pressure rises after a choke restriction and the oil rate falls, the response may be expected. If pressure rises while rate falls without a choke change, a downstream restriction, separator backpressure issue, or meter problem may deserve investigation.
🔍 Distinguish a Real Change from Measurement Noise
Before diagnosing the reservoir, check whether the apparent change exceeds normal process variation and measurement uncertainty. Compare independent indications where available: a local gauge against a transmitter, test-separator results against allocation data, or a second temperature measurement against the primary signal.
A hypothetical example illustrates the approach. If a reported oil rate drops shortly after a meter maintenance event while wellhead pressure and choke position remain unchanged, validate the meter configuration first. A true decline remains possible, but the timing makes data quality a reasonable first question.
🚧 Investigate Rising Backpressure
Backpressure is the pressure resisting flow downstream of the producing interval. It can increase because of a more restrictive choke, higher flowline pressure, separator pressure changes, hydrate risk controls, liquid accumulation, wax, scale, or partially closed valves.
Higher backpressure generally reduces the pressure drawdown available to move fluids from the reservoir into the well. The right response depends on the cause. Opening a choke may help in one case but worsen downstream constraints or exceed operating limits in another.
🫧 Watch for Liquid Loading in Gas Wells
A gas well may lose the velocity needed to carry produced liquids to surface. Liquid accumulates in the tubing, increasing hydrostatic pressure and reducing gas flow further. This feedback process is commonly called liquid loading.
Clues can include cyclic pressure behavior, intermittent bursts of production, declining gas rate, and increased liquid returns during unloading. Diagnosis should combine surface trends with well configuration and, where justified, additional surveillance. Surface symptoms alone do not prove the mechanism.
⚙️ Account for Artificial-Lift Effects
Artificial lift changes the relationship between surface pressure and production rate. Gas lift depends on injection pressure, injection rate, valve operation, and available lift gas. Rod pumping, electric submersible pumps, and progressive cavity pumps introduce different operating signatures and failure modes.
When a lifted well becomes unstable, include lift-system data in the review. A declining rate may reflect pump intake conditions, gas interference, injected-gas changes, power issues, or mechanical performance rather than a reservoir change alone.
🧱 Consider Restrictions and Solids
Wax, scale, sand, corrosion products, hydrates, and debris can restrict flow through tubing, chokes, flowlines, and separator equipment. Restrictions often create an increasing pressure drop across the affected point, but the exact pattern depends on where the restriction sits.
Operational evidence should be combined carefully: choke differential pressure, flowline pressure, temperature, solids observations, chemical history, and inspection data may point in the same direction. Avoid diagnosing a restriction solely because production declined; reservoir and lift causes can look similar at first.
🧾 Build a Repeatable Field Data Sheet
A consistent field record reduces ambiguity between shifts and makes later analysis much easier. It should identify the well, measurement points, instruments, operating configuration, and data quality observations.
- Date, time, and responsible operator
- Well status, routing, and choke type and setting
- Tubing, casing, upstream-choke, downstream-choke, and flowline pressures where applicable
- Oil, water, gas, and total-liquid rates with stated basis
- Temperature, separator pressure, and test duration
- Instrument identification, calibration status, and unusual conditions
Good records also state what changed. “Choke adjusted,” “well routed to test,” or “separator level unstable” can explain trends that otherwise appear mysterious weeks later.
🧠 Avoid Common Interpretation Mistakes
Several errors recur in production surveillance because they are convenient shortcuts. The solution is not more data alone; it is disciplined comparison of like with like.
- Comparing pressures from different locations without accounting for the choke or flowline.
- Calling a well unstable from a single short observation during slugging.
- Comparing gas volumes reported at different reference conditions.
- Assuming a test result represents normal production before stabilization.
- Changing operating settings before documenting baseline conditions.
- Attributing every rate decline to reservoir depletion without checking equipment and measurement quality.
🔁 Use a Structured Troubleshooting Sequence
When production changes unexpectedly, start with safety and operating status, then move from simple checks to more involved diagnosis. Verify routing, valve lineup, choke setting, instrument health, and recent interventions before requesting complex analysis.
- Confirm the reading and compare it with an independent indication if possible.
- Check whether operating conditions changed at the same time.
- Review pressure and rate trends over an appropriate period.
- Locate where the pressure behavior changed along the surface flow path.
- Assess lift performance, fluids, and likely restrictions.
- Escalate to well testing, sampling, or subsurface surveillance when evidence supports it.
This sequence does not replace site procedures or engineering judgment, but it reduces unnecessary adjustments based on a single suspect number.
🖥️ Combine Automation with Field Verification
Remote pressure transmitters, automated test systems, and production databases make continuous surveillance practical. They are especially valuable for detecting gradual trends and for comparing multiple wells across a field.
Yet automation can propagate an error quickly if a transmitter is misranged, a tag is mapped incorrectly, or a calculation uses outdated fluid properties. Periodic field checks provide a reality check between what the system displays and what the equipment is doing.
🤝 Communicate Results in an Actionable Form
A strong production note does more than report numbers. It states the observation, operating context, confidence level, likely explanations, and recommended next check. This helps operations, production engineering, facilities, and reservoir teams work from the same facts.
For example: “Oil rate appears lower during the last stabilized test; tubing-head pressure increased at unchanged choke setting; separator pressure was normal; verify flowline differential pressure and inspect for restriction indicators.” This is clearer than simply writing “well down.”
🧩 Bring Pressure, Rate, and Stability Together
The central principle is simple: measure each variable at a defined point, under known conditions, with an instrument suited to the task—then interpret the trends together. Wellhead pressure explains part of the force balance, flow rate describes delivered production, and stability shows whether that behavior is repeatable.
No single measurement can fully diagnose a well. A trustworthy picture comes from verified instruments, consistent rate bases, adequate stabilization time, clear operational records, and cautious interpretation of multiphase and artificial-lift effects.
Reliable production decisions begin with measurements that are traceable, comparable, and understood in their operating context. That discipline helps teams spot genuine well changes early while avoiding costly reactions to misleading data. 🛢️📈🔧