
A well may be drilled thousands of metres below the surface, completed across a promising interval, and connected to a production facility. Yet none of that guarantees flow. The fluids still need a driving force that moves them from tiny pore spaces in the rock toward the wellbore.
That driving force is usually described in one word: pressure. But reservoir pressure is not simply a number on a gauge. It is part of a changing underground energy system involving rock, oil, gas, water, depth, temperature, and the operating choices made at the surface.
For a production engineer, pressure helps determine whether a well will flow naturally, need artificial lift, produce unwanted water, or approach damaging operating conditions. For a student, it is one of the clearest ways to connect fluid mechanics, rock properties, and field development decisions.
Picture a sealed fizzy drink: opening it creates a lower-pressure outlet, and dissolved gas expands as pressure falls. A reservoir is far more complex than a bottle, but the central idea is similar: fluids move when there is a usable pressure difference and a connected path.
🧭 Reservoir Pressure Is Underground Stored Energy
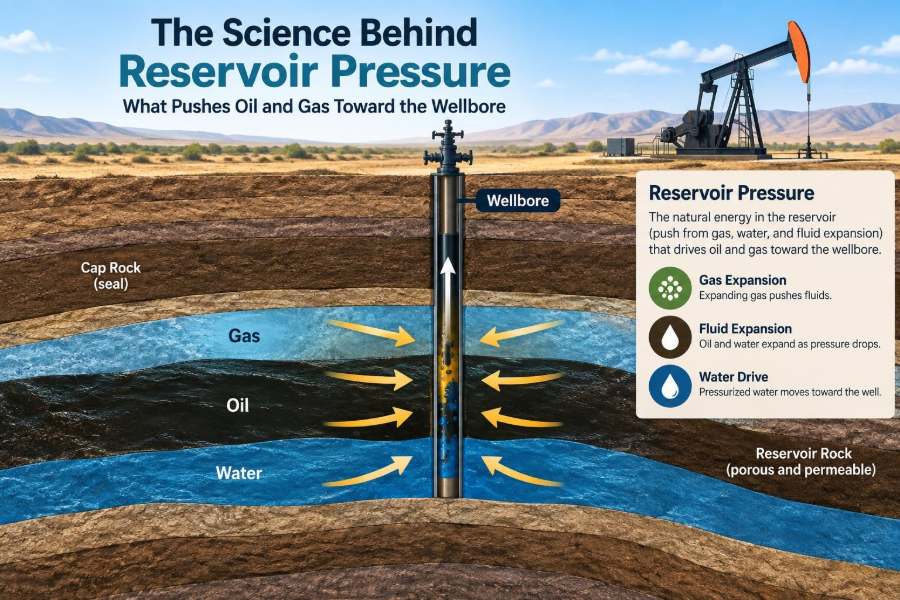
Reservoir pressure is the pressure exerted by fluids within the pore spaces of a reservoir rock. It reflects the energy available to move oil, gas, and water through the formation and ultimately into a well.
A reservoir is not an open underground lake. It is a network of microscopic pores and narrow pore throats in rocks such as sandstone or carbonate. Fluids must navigate that network, so pressure alone is not enough; rock connectivity and fluid mobility matter too.
Initial pressure is established over geological time by burial, fluid migration, compaction, temperature, and sealing. Once production begins, the pressure system evolves continuously.
📏 Pressure at Depth: Why a Single Number Can Mislead
Pressure generally rises with depth because fluids have weight. This hydrostatic effect means that pressure measured at one depth cannot always be compared directly with pressure at another depth without accounting for fluid density and vertical distance.
Engineers often use a pressure gradient: pressure change per unit depth. Water normally has a steeper gradient than oil, while gas has a much smaller gradient because it is less dense.
In a static, connected reservoir, measurements plotted against depth can reveal fluid contacts and gradients. Departures from expected trends may indicate separate compartments, measurement problems, changing fluid composition, or dynamic flow effects.
🔄 The Pressure Difference That Starts Flow
Fluids flow toward a well when pressure in the reservoir near the drainage area is higher than pressure at the sandface or flowing bottomhole. This difference is commonly called drawdown.
A simple expression is:
Drawdown = average reservoir pressure − flowing bottomhole pressureDrawdown is the practical “push” available to bring fluid into the well. If it is too small, the well may produce little. If it is too large, the well may invite water or gas too aggressively, damage the formation, or exceed equipment limits.
🪨 Permeability Determines Whether Pressure Can Be Used
Permeability is the rock’s ability to transmit fluid. A reservoir can have substantial pressure but poor production if its pore throats are too tight or poorly connected for hydrocarbons to move at useful rates.
Think of pressure as the force behind a tap and permeability as the openness of the pipe. A strong supply pressure does little if the pipe is almost blocked.
Natural fractures can improve flow in some low-permeability formations, while cementation, fine particles, clay swelling, or completion damage can reduce effective flow capacity near the well.
🧽 Porosity Stores Fluids, but Does Not Guarantee Deliverability
Porosity is the fraction of rock volume occupied by pores. It determines how much fluid a rock can store, but it does not directly tell us how easily that fluid can flow.
A rock may contain many pores that are isolated or linked only by very narrow throats. Conversely, a lower-porosity rock with well-connected pathways may deliver fluids effectively.
This distinction matters in reservoir evaluation: storage and flow are related, but they are not interchangeable properties.
💧 Saturation Explains Who Occupies the Pores
Reservoir pores commonly contain more than one fluid phase. Water, oil, and gas compete for space, and the fraction of pore volume occupied by each is called saturation.
Not all fluid in place can move. Some water remains held by capillary forces, and some oil may be trapped as disconnected droplets after water advances. The mobile share depends on saturation, wettability, pore geometry, and the history of displacement.
Thus, pressure can act on several phases at once, but each phase may respond differently.
🧪 Viscosity Controls Resistance to Motion
Viscosity describes a fluid’s resistance to flow. Light oil and gas generally move more readily than heavy oil under the same pressure gradient, assuming comparable rock and saturation conditions.
This is why a pressure decline that remains adequate for a light-oil well may be insufficient for a heavy-oil well. Heavy oil often requires greater drawdown, thermal methods, dilution, or other assistance, subject to reservoir and operational constraints.
Temperature, pressure, and composition all affect viscosity. Reservoir-fluid properties should therefore be represented with appropriate laboratory data and pressure-volume-temperature analysis rather than guessed from surface appearance.
📐 Darcy’s Law Connects Pressure and Flow Rate
At a foundational level, fluid movement through porous media is described by Darcy’s law. In simplified form, flow rate increases with permeability, flow area, and pressure difference, and decreases with viscosity and flow distance.
For radial flow toward a well, the geometry becomes more complex because fluid converges from a broad drainage area into a narrow wellbore. Still, the logic remains: a larger usable pressure gradient and better flow capacity tend to increase rate.
Real reservoirs add multiphase flow, changing properties, heterogeneity, capillary pressure, fractures, and wellbore effects. Darcy’s law is a starting framework, not a complete field model.
🧲 Effective Permeability Changes in Multiphase Flow
When oil, water, and gas coexist, each phase does not enjoy the rock’s full absolute permeability. Its ability to flow is described through relative permeability, which depends largely on saturation.
As water saturation rises, water usually gains mobility while oil often loses it. As free-gas saturation rises, gas mobility can increase, but oil flow can be impaired.
This explains why rising water cut or gas-oil ratio may reflect more than a change in volumes produced: the flow paths and mobility balance inside the reservoir have changed.
🫧 Solution Gas Drive: Expansion from Within the Oil
Some oil reservoirs initially contain gas dissolved in the oil. When pressure falls below the bubble-point pressure, gas begins to come out of solution and forms a separate gas phase.
The expanding gas can help displace oil toward the wellbore. However, solution-gas drive is often less efficient than mechanisms with strong water support because gas may move more easily than oil, bypassing part of the oil and raising produced gas volumes.
The exact response depends on oil properties, rate of pressure decline, rock characteristics, and whether gas remains dispersed or develops a connected flow path.
🎈 Gas-Cap Drive: Expansion Above the Oil
A reservoir may contain a free-gas cap above the oil column. As pressure declines, this gas expands and can provide energy that helps move oil downward and toward producing wells.
Gas-cap drive can be valuable, but production strategy matters. Producing too aggressively near the gas cap may lead to early gas breakthrough, reducing oil productivity and potentially wasting useful pressure support.
Well placement, completion intervals, rate control, and gas reinjection can all be considered where the reservoir model supports them.
🌊 Water Drive: Support from an Aquifer
Many reservoirs are connected to an aquifer, a water-bearing formation that can supply water as hydrocarbons are withdrawn. Water influx may partly replace produced volume and slow the average pressure decline.
A strong water drive can support sustained production, but it also brings the risk of increasing water production and early water breakthrough. The outcome depends on aquifer size, connectivity, rock layering, permeability contrasts, and well locations.
Water support is not automatically good or bad. It is an energy source that must be understood and managed.
🪨 Rock and Connate-Water Expansion Add Smaller Contributions
As pressure falls, both reservoir rock and the water bound within pores can expand slightly. This rock-and-fluid expansion contributes energy, especially before gas evolves from solution or where other drive mechanisms are weak.
Its contribution is often modest compared with a strong aquifer or large gas cap, but it should not be ignored in material-balance thinking. Small compressibility effects acting across a large reservoir volume can be meaningful.
Compaction may also change pore volume and permeability. In some formations, it supports production energy; in others, it creates serious geomechanical risks.
🏭 Compaction Drive Comes with Geomechanical Consequences
In compacting reservoirs, declining pore pressure increases the effective stress carried by the rock framework. The rock may compress, reducing pore volume and helping expel fluids.
This mechanism can contribute to recovery, but it may also cause permeability loss, well deformation, casing damage, seabed subsidence, or surface subsidence. The balance is field-specific.
A reservoir engineer cannot treat compaction as only a source of energy. It requires integration with geomechanics, completion design, surveillance, and facility planning.
⚖️ Natural Drive Mechanisms at a Glance
| Drive mechanism | Primary energy source | Typical operational concern |
|---|---|---|
| Solution-gas drive | Gas evolving and expanding from oil | Rapid pressure decline and high gas production |
| Gas-cap drive | Expansion of a free-gas cap | Gas coning or early gas breakthrough |
| Water drive | Water influx from an aquifer | Water breakthrough and handling costs |
| Rock/fluid expansion | Compressibility of rock and fluids | Limited energy in many cases |
| Compaction drive | Pore-volume reduction under stress | Subsidence and well-integrity risks |
Real reservoirs often exhibit several mechanisms simultaneously. Classifying a field by one “dominant” drive is useful, but it should not erase the secondary mechanisms that can influence decisions.
🕳️ The Wellbore Is a Low-Pressure Outlet, Not a Vacuum
Production lowers pressure near the perforations, creating a local gradient toward the well. The well does not pull fluids with a vacuum; rather, reservoir fluids move toward a lower-pressure boundary.
Pressure continues to fall as fluids travel up the tubing because energy is consumed overcoming hydrostatic head, friction, acceleration, and restrictions such as chokes. A flowing well is therefore a connected pressure system from reservoir to separator.
If backpressure at the surface rises, bottomhole flowing pressure may rise too, reducing drawdown and production rate.
🌀 Skin Describes Extra Resistance Near the Well
Skin is a dimensionless measure of additional pressure loss near the wellbore compared with an ideal completion. Positive skin indicates extra resistance; negative skin indicates improved flow capacity, often after an effective stimulation treatment.
Positive skin can result from drilling-fluid invasion, fines migration, scale, wax, perforation limitations, partial penetration, or damaged natural fractures. It means more pressure is being spent close to the well instead of moving fluid from the broader reservoir.
Skin is not merely a diagnostic label. It can guide decisions about cleanup, acidizing, reperforation, fracture stimulation, or whether the real limitation lies elsewhere.
📉 Pressure Depletion Creates a Drainage Pattern
When a well produces, the pressure disturbance spreads outward through the reservoir. Near the well, pressure changes first and most strongly; farther away, the response arrives later depending on transmissibility, storage, boundaries, and rate history.
This changing pattern is often called a pressure transient. Analyzing it can reveal useful information about permeability, skin, boundaries, fractures, and communication between regions.
In a multiwell field, pressure depletion from neighbouring wells may overlap. A production change at one well can therefore affect the performance of another.
📊 Average Reservoir Pressure Is an Estimate, Not a Guess
Engineers use the concept of average reservoir pressure for reserves assessment, material balance, forecasting, and recovery planning. But a single average value can conceal major differences between layers, compartments, or areas of a field.
Reliable estimates may combine shut-in pressure surveys, permanent downhole gauges, buildup analysis, production data, fluid contacts, and calibrated reservoir simulation. Each source has limitations.
A pressure measured immediately after shutting in a well may not represent the whole reservoir if the well has not had enough time to stabilize or if the field is heterogeneous.
🧭 Pressure Communication Reveals Reservoir Connectivity
If a pressure change in one well is detected in another, the wells may be hydraulically connected through the reservoir. The timing and size of the response can provide clues about transmissibility and barriers.
A lack of response does not prove isolation. The signal may be too weak, the observation period too short, the wells may be far apart, or operating noise may obscure the result.
Interference testing and integrated surveillance are especially valuable where faults, shale barriers, channelized sands, or layered carbonate systems may compartmentalize the reservoir.
🧱 Faults and Layers Can Divide the Pressure System
Geological structure strongly affects pressure behaviour. A fault may seal fluids, partially restrict crossflow, or transmit fluids depending on its displacement, clay content, stress state, and contact relationships.
Likewise, thin shales or tight streaks can separate permeable layers. Two intervals at similar depths can have different pressures, contacts, and depletion histories.
Assuming field-wide communication without evidence can lead to misplaced wells, inaccurate forecasts, and incorrect estimates of available pressure support.
🌡️ Temperature and Fluid Phase Behaviour Matter
Reservoir temperature influences density, viscosity, gas solubility, and phase behaviour. Pressure reduction alone does not tell the full story; the fluid’s pressure-temperature path determines whether gas evolves, condensate drops out, or a fluid remains single phase.
In gas-condensate reservoirs, pressure falling below the dew point can cause liquid condensate to form near the wellbore. This liquid banking can reduce gas relative permeability and restrict deliverability even when substantial gas remains in place.
Accurate phase-behaviour modelling relies on representative fluid samples and careful interpretation. Surface samples may not fully represent original reservoir fluid after phase changes occur.
🔥 Drawdown Is a Tool That Must Be Managed
Higher drawdown can increase short-term rate, but the best operating rate is not always the highest possible rate. The right target depends on reservoir drive, well completion, water and gas risks, facilities, economics, and long-term recovery objectives.
Excessive drawdown may cause:
- water or gas coning toward perforations;
- sand production in weak formations;
- fines migration and formation damage;
- rapid gas liberation near the well;
- unstable flow or excessive liquid loading in gas wells.
Rate management is therefore a reservoir-management decision, not simply a surface choke-setting exercise.
🌪️ Coning Brings Unwanted Fluids to the Well
Water beneath an oil zone and gas above it are held in a gravitational arrangement. A strong localized pressure drawdown near a producing well can deform these interfaces into a cone shape, bringing water or gas into the completion.
Coning is more likely when vertical permeability is high, the completion is close to a fluid contact, or production rate is excessive for the reservoir geometry. It can also be influenced by heterogeneity and fractures.
Potential mitigations include rate reduction, selective completion placement, inflow-control devices, isolation of watered-out intervals, or alternative well trajectories. No single measure works in every setting.
🚰 Water Breakthrough Is Not Always Coning
Water production can arrive through several routes. Coning is one mechanism, but water may also move through a high-permeability streak, fracture, behind-casing channel, edge-water encroachment, or a thief zone connected to injection.
This distinction matters because the remedy depends on the cause. Reducing rate may help coning but may do little for a mechanical channel behind pipe. A sound diagnosis combines production trends, pressure data, logs, tracer information where appropriate, and reservoir understanding.
Treating every water increase as the same problem is a common and costly mistake.
💉 Water Injection Replaces Withdrawn Volume
Waterflooding injects water into selected wells to maintain pressure and displace oil toward producers. It is a widely used secondary-recovery approach because water is generally available, relatively inexpensive to handle compared with some alternatives, and effective in suitable reservoirs.
Its performance depends on injection pattern, rock heterogeneity, mobility ratio, water quality, areal and vertical sweep, and surveillance. Injected water may bypass oil through more permeable paths if conformance is poor.
Injection pressure must also be managed to avoid unintended fracture growth, loss of containment, or adverse communication with other intervals.
♻️ Gas Injection Can Support Pressure and Improve Displacement
Gas may be reinjected to preserve pressure, manage produced gas, support a gas cap, or improve oil displacement. Depending on composition and pressure, injected gas can be immiscible with oil or approach miscible behaviour that reduces interfacial effects and can improve displacement efficiency.
Gas injection is not universally suitable. Availability, compression energy, recycling requirements, corrosion, gravity segregation, containment, and economics all shape feasibility.
Reservoir simulation and laboratory fluid characterization are especially valuable before making decisions about injection composition and pressure targets.
🧰 Artificial Lift Helps the Well, Not the Reservoir
As reservoir pressure declines, a well may no longer have enough energy to lift liquids to the surface at an economic rate. Artificial lift lowers flowing bottomhole pressure or adds energy in the wellbore, increasing drawdown and helping fluids reach the surface.
Common systems include rod pumps, electrical submersible pumps, gas lift, progressive cavity pumps, and hydraulic methods. Selection depends on rate, depth, fluid properties, gas content, solids, deviation, power availability, and intervention strategy.
Artificial lift does not restore reservoir pressure. It changes the well’s pressure requirement and can allow remaining reservoir energy to be used more effectively.
🔍 Pressure Surveillance Turns Assumptions into Decisions
Pressure management improves when measurements are taken with a clear purpose. Useful data may include static pressure surveys, flowing pressures, buildup and drawdown tests, injection falloff tests, permanent gauge records, and pressure data from formation testers during drilling.
Quality matters as much as quantity. Gauge calibration, depth reference, fluid gradients, shut-in duration, wellbore storage, and operating context all affect interpretation.
A pressure value without its measurement conditions can be misleading. Engineers should ask: where was it measured, when, under what flow conditions, and does it fit the broader reservoir picture?
🧮 Material Balance Checks Whether the Volume Story Makes Sense
Material balance applies conservation of mass to a reservoir. In practical terms, it compares withdrawals of oil, gas, and water with the expansion and influx mechanisms that could supply those withdrawals.
If observed pressure decline is slower than a closed-reservoir model predicts, water influx or another support mechanism may be present. If pressure drops faster than expected, connectivity, volume estimates, or assumptions about influx may need review.
Material balance is most reliable when production allocation, pressure estimates, fluid properties, and reservoir boundaries are understood well enough to constrain uncertainty.
💻 Reservoir Simulation Tests Competing Pressure Scenarios
A reservoir simulation model represents the field with grids, rock properties, fluid behaviour, wells, and operating controls. It can test scenarios such as different production rates, injection patterns, completion depths, or pressure-maintenance strategies.
A model is useful when it is calibrated against observed pressure, rates, water cut, gas-oil ratio, and other relevant history. A visually sophisticated model with weak data conditioning can still produce unreliable forecasts.
Simulation should support engineering judgement, not replace it. The best use is often to compare plausible alternatives and understand sensitivity to uncertain inputs.
⚠️ Common Pressure-Management Mistakes
Several recurring errors make reservoir-pressure decisions less reliable:
- Equating high initial pressure with high productivity: tight rock or poor relative permeability can still limit flow.
- Using a single well measurement as field-wide truth: compartments and transient conditions can invalidate that assumption.
- Chasing maximum rate without diagnosing limits: short-term gains can accelerate water, gas, sand, or damage problems.
- Ignoring surface constraints: separator pressure, tubing restrictions, and liquid handling directly affect bottomhole conditions.
- Assuming injected fluid sweeps evenly: heterogeneity often directs water or gas along preferred paths.
Good reservoir management repeatedly compares expectations with surveillance data and adjusts the model when evidence conflicts with assumptions.
🧠 A Practical Workflow for Evaluating Pressure Performance
When investigating a production or pressure issue, a disciplined sequence helps prevent premature conclusions:
- Confirm the data quality, gauge depth, reference datum, and operating conditions.
- Compare current flowing and static pressures with historical trends.
- Review rates, water cut, gas-oil ratio, choke changes, and artificial-lift performance.
- Check completion intervals, nearby wells, injection activity, and geological barriers.
- Estimate whether the limitation is reservoir inflow, near-wellbore skin, wellbore hydraulics, or surface backpressure.
- Select surveillance or intervention that tests the leading explanation.
This workflow does not eliminate uncertainty, but it makes uncertainty visible and links decisions to observable evidence.
🎯 The Core Principle: Flow Needs Energy, Mobility, and a Path
Oil and gas move toward a wellbore because the flowing pressure near the well is lower than pressure farther out in the reservoir. That pressure difference supplies the driving energy, but the resulting rate is controlled by permeability, relative permeability, viscosity, saturation, geometry, completion condition, and wellbore pressure losses.
Natural mechanisms such as gas expansion, water influx, and rock compaction can sustain or alter the pressure system. Operations such as injection, choke management, stimulation, and artificial lift then influence how effectively that energy is converted into useful production.
The most durable lesson is to view reservoir pressure as part of a connected system rather than an isolated measurement. Rocks, fluids, wells, and facilities all share the same pressure story.
Reservoir pressure pushes hydrocarbons toward the well only when a pressure gradient, mobile fluids, and connected flow paths work together. Understanding that relationship is the foundation of sound production and reservoir-management decisions. 🛢️📈🔧