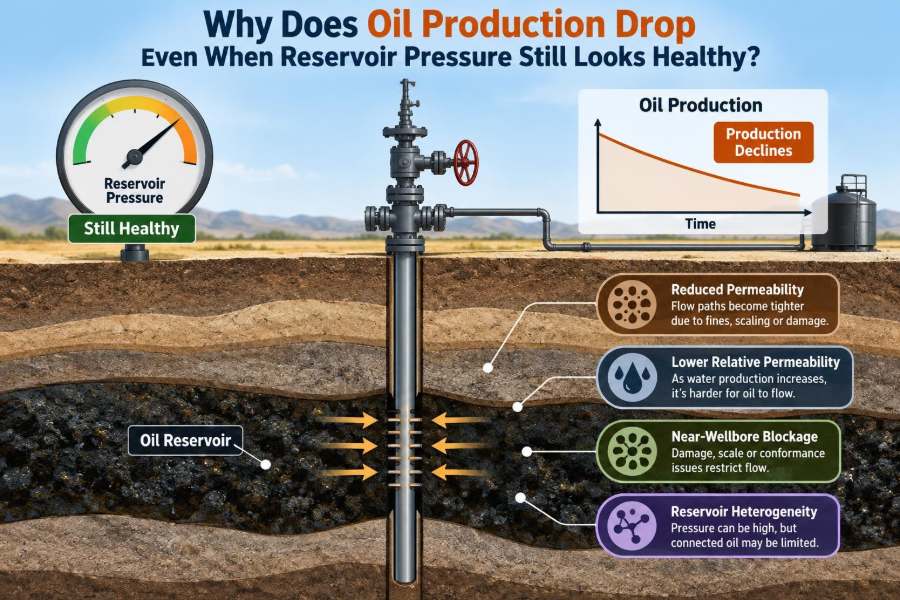

A field team sees a familiar and frustrating pattern: the average reservoir pressure remains close to expectations, yet oil rate has slipped well below the production forecast. The first instinct is often to blame depletion. But the pressure data appears to say the reservoir still has energy.
This is not necessarily a contradiction. Reservoir pressure describes only one part of the route from oil in the rock to oil at the surface. A well produces only when that route has enough mobility, connectivity, pressure drawdown, and operating capacity.
Think of pressure as the height of water in a municipal tank. A full tank does not guarantee a strong flow from every household tap; a blocked pipe, a partly closed valve, or a pump limitation can still reduce delivery. Oil wells behave similarly, although the subsurface physics is much more complex.
Understanding this distinction helps engineers avoid costly wrong turns. It changes the diagnostic question from “Does the reservoir have pressure?” to “Where is the resistance, and which fluid is actually able to move?”
🧭 Pressure Is Not the Same as Productive Capacity
Reservoir pressure is the pressure measured within the pore fluids of a reservoir. It reflects stored energy, fluid expansion, and support from mechanisms such as water influx or gas-cap expansion.
Productivity is the well’s ability to deliver fluids at a useful rate for a given pressure drawdown. A reservoir can retain relatively high pressure while productivity declines because flow toward the well has become harder or because the wellbore system has become more restrictive.
This distinction is the starting point for every sound diagnosis.
📉 The Production-Rate Equation in Plain Language
For a simple oil well, rate is often represented conceptually by q = J(Pr − Pwf), where q is liquid rate, J is productivity index, Pr is average reservoir pressure, and Pwf is flowing bottomhole pressure.
If average reservoir pressure stays healthy but the rate falls, either the available drawdown has narrowed, the productivity index has declined, or both. The equation is simplified, but it directs attention to the right variables.
A falling J means the same pressure difference now produces less fluid. That can happen in the rock, near the well, in the completion, or in the production system.
🪨 Permeability Controls How Easily Oil Can Travel
Permeability describes how readily a rock allows fluids to flow through connected pore spaces. It is not fixed in every practical sense: the effective flow capacity can decline as fluids redistribute, fines move, clays react, or stress changes around the well.
Even a reservoir with ample pressure cannot deliver high rates through a low-permeability pathway. In layered reservoirs, the pressure measurement may represent a broad interval while the well’s best-producing layers have already weakened or become inaccessible.
Pressure is the driving force; permeability is much of the pathway.
💧 Relative Permeability Changes as Water Arrives
Reservoir rock commonly contains more than one fluid phase. As water saturation increases near a producing well, water may occupy pore throats that previously carried oil. The rock can still transmit fluids, but its relative permeability to oil falls.
This does not require a dramatic pressure decline. Water support may actually help preserve average pressure while water production rises and oil mobility deteriorates.
The result is a well that appears pressure-supported but becomes less effective at producing oil.
🌊 Water Breakthrough Can Mask an Oil-Rate Problem
Water breakthrough occurs when formation water reaches the well through a high-permeability layer, fracture, channel, or advancing waterfront. The well may continue producing a substantial total liquid volume while its oil rate declines.
This distinction matters operationally. A report that focuses on total fluid rate may initially look reassuring, whereas the oil rate, water cut, and fluid-level behavior reveal a different story.
- A uniformly advancing waterfront often causes a gradual water-cut increase.
- A sharp early increase can suggest channeling, fracture flow, or an unwanted high-permeability connection.
- Rising water handling can also constrain facilities and force a lower total production rate.
🧪 Gas Liberation Can Reduce Oil Mobility
When pressure near the well falls below the bubble-point pressure, dissolved gas comes out of solution. Some gas can help drive fluids, but gas saturation near the well may reduce the relative permeability to oil.
If free gas becomes mobile, it can flow preferentially toward the well. That changes phase behavior and can produce a high gas-oil ratio while oil rate falls. Average reservoir pressure may still look acceptable because the most severe pressure drop is local, close to the wellbore.
Average pressure therefore should not be confused with the pressure experienced by oil at the sandface.
🕳️ Near-Wellbore Damage Adds Skin
Skin is a practical measure of extra pressure loss near the wellbore. Positive skin means the well requires additional drawdown to deliver a given rate; negative skin usually indicates stimulation has improved flow.
Damage may arise from drilling-fluid invasion, completion fluids, scale, fines, emulsions, wax, organic deposits, or incompatible injected water. A thin damaged zone can matter greatly because nearly all converging flow passes through it.
In effect, healthy reservoir pressure is being spent pushing fluid through a local bottleneck.
🧱 Formation Damage Is Not One Single Mechanism
Calling a well “damaged” is only the beginning. The remedy depends on the mechanism, and treatments can fail when the mechanism is misidentified.
| Mechanism | Typical effect | Diagnostic clue |
|---|---|---|
| Fines migration | Pore-throat plugging | Rate loss after drawdown or fluid change |
| Scale deposition | Restriction in perforations or tubing | Pressure losses and compatible chemistry concerns |
| Wax or organic deposits | Reduced flow area | Temperature-sensitive decline |
| Water block | Reduced oil relative permeability | Often follows fluid invasion or workover |
Several mechanisms can coexist, so a single “cleanup” explanation should be tested rather than assumed.
🔫 Perforations Can Become the Restriction
Perforations connect cased-hole wells to the reservoir. Their tunnel length, density, orientation, cleanup, and condition strongly influence inflow. Crushed zones, debris, scale, or poor communication can impose significant pressure loss.
A pressure gauge reading above the completion may not show how much pressure is lost across individual perforations. This is one reason production logging and targeted diagnostic work can be more revealing than a single pressure measurement.
Good reservoir energy cannot compensate indefinitely for poor entry into the well.
🧭 Flow Is Rarely Uniform Across a Reservoir
Reservoirs are heterogeneous. Sand quality, permeability, thickness, faults, shale barriers, natural fractures, and fluid contacts vary from place to place. A pressure value is often an average or a local measurement, not a map of every flow path.
A well may initially drain a highly productive streak and later depend on tighter rock. Meanwhile, pressure in less-depleted or water-supported portions of the reservoir can keep the reported average pressure looking healthy.
The relevant question is not just “What is the pressure?” but “Which volumes are connected to this well?”
🧩 Compartmentalization Limits Accessible Oil
Faults, sealing shales, stratigraphic pinch-outs, and low-permeability barriers can divide a field into compartments. A pressure survey may capture support in one compartment while a specific well has depleted its own connected volume.
Conversely, pressure communication may exist but fluid communication may be poor on the timescale of production. The reservoir can contain oil and energy, yet deliver it too slowly to sustain the target rate.
Interference tests, pressure-transient interpretation, seismic context, and production history can help distinguish weak connectivity from simple depletion.
🪜 Gravity Segregation Changes What Reaches the Well
Oil, gas, and water separate under gravity when the reservoir geometry and time allow it. Gas tends to migrate upward and water downward, while oil occupies an intermediate interval.
A well’s perforated depth therefore matters. Producing too close to a gas cap can promote gas coning; producing too near an aquifer can encourage water coning. In either case, oil rate may decline even with strong overall pressure support.
Completion placement is a flow-control decision, not merely a mechanical detail.
🌪️ Water and Gas Coning Are Local Flow Problems
Coning occurs when high drawdown pulls water upward or gas downward toward perforations faster than gravity segregation can stabilize the fluid contacts. It is often associated with aggressive rates, but reservoir architecture also matters.
Once breakthrough happens, reducing the rate may help in some cases, but it does not always reverse the problem. The response depends on permeability distribution, completion depth, fluid contacts, and whether a channel has formed.
Producing harder can therefore reduce oil efficiency rather than improve it.
🧱 Crossflow Can Shift Fluids Between Layers
In a commingled completion, layers with different pressures can exchange fluid through the wellbore when the well is shut in or producing. This is called crossflow.
A high-pressure water-bearing interval can feed water into a lower-pressure oil interval, or a strong layer can dominate production while weaker oil-bearing layers contribute little. Surface measurements then conceal layer-by-layer behavior.
Production logging is particularly valuable when crossflow or unequal zonal contribution is suspected.
📏 Average Pressure Can Be a Misleading Average
Pressure data must be interpreted with its measurement context. Was it recorded after adequate shut-in time? Is the gauge depth known? Does it represent static pressure, flowing pressure, or a modeled estimate? Which completion interval does it actually sample?
A single “average pressure” value can be influenced by a connected high-pressure zone, hydrostatic corrections, or incomplete stabilization. It may be accurate for its purpose and still insufficient for explaining a rate decline.
Data quality is not a side issue; it controls the diagnosis.
⏱️ Flowing Bottomhole Pressure May Be the Missing Data
Static reservoir pressure tells engineers about stored energy. Flowing bottomhole pressure shows the pressure available at the producing sandface while the well is delivering fluids.
Comparing these pressures over time helps separate reservoir behavior from well impairment. If flowing bottomhole pressure rises at a similar choke setting while rate falls, a changing wellbore or artificial-lift condition may be involved. If much more drawdown is required for the same rate, productivity may have declined.
Interpretation still requires multiphase-flow and equipment context.
📈 Productivity Index Reveals the Trend
Tracking productivity index over time is more informative than comparing rates alone. Rates change with choke settings, separator pressure, downtime, fluid properties, and lift performance; productivity index attempts to normalize rate against drawdown.
A declining index does not identify the mechanism by itself. It is a warning that the well-reservoir system is becoming less capable of converting pressure difference into flow.
Engineers should compare like-for-like operating conditions whenever possible.
🛠️ Artificial Lift Can Limit a Strong Reservoir
Many wells need artificial lift because reservoir pressure alone cannot carry fluids to surface at an economic rate. Electrical submersible pumps, rod pumps, gas lift, and other systems each have operating envelopes.
A pump can wear, gas-lock, lose efficiency, become undersized for rising water cut, or operate outside its preferred range. Gas lift valves and injection allocation can also change performance. In such cases, the reservoir may be capable of supplying fluid, but the lifting system cannot remove it efficiently.
The apparent production decline is then partly a surface-to-sandface delivery problem.
🚧 Tubing, Chokes, and Flowlines Create Backpressure
Every restriction downstream of the sandface raises the pressure the well must overcome. Scale in tubing, a small choke, high separator pressure, liquid loading, wax deposition, or a constrained flowline can increase backpressure.
For multiphase flow, small changes can sometimes alter flow regime and create unstable behavior. Slugging, intermittent flow, and liquid holdup may reduce average production even though reservoir pressure has changed little.
A nodal analysis connects inflow performance from the reservoir with outflow performance through the completion and facilities.
🏭 Surface Constraints Can Look Like Reservoir Decline
Produced-water treatment limits, gas compression capacity, separator constraints, pipeline pressure, flaring restrictions, and maintenance outages can all force wells to be choked back. The production history may show a decline that is operational rather than geological.
These constraints are not trivial bookkeeping details. A reduced liquid target can alter drawdown, worsen liquid loading, and affect how reservoir data is interpreted.
Always examine allocated production, choke history, downtime codes, and facility conditions alongside subsurface trends.
🧫 Fluid Properties Can Change the Flow Resistance
Oil viscosity is a major determinant of mobility. Cooling in the wellbore, pressure changes, compositional evolution, emulsions, and water cut can all change the effective resistance to flow.
In some crude oils, wax precipitation or higher apparent viscosity at lower temperature makes the tubing system increasingly restrictive. In others, stable emulsions complicate separation and may influence measured fluid behavior.
Laboratory fluid data and field samples are useful, but they must be representative of current conditions.
🪤 Sand Production and Solids Can Reduce Deliverability
Unconsolidated formations may produce sand when drawdown exceeds the rock’s ability to remain stable. Sand can erode equipment, fill perforations, restrict flow paths, and require conservative operating limits.
Fines and solids may also accumulate in screens, gravel packs, separators, or low points in the tubing. A well can have ample pressure but be deliberately rate-limited to control sand or prevent equipment damage.
The safest operating rate is not always the highest short-term rate.
🧠 A Hypothetical Diagnostic Example
Consider a hypothetical water-driven sandstone well. Its measured average reservoir pressure changes only modestly over several months, but oil rate falls while water cut rises. Total liquid rate initially remains similar.
A quick conclusion might be that the well is “fine because pressure is healthy.” A better interpretation is that water is replacing oil in the near-wellbore flow paths, reducing oil relative permeability. If a production log then shows most water entering from one high-permeability interval, the response may focus on zonal control rather than broad reservoir stimulation.
The evidence changes the intervention.
🔍 Build a Diagnosis From Multiple Data Sources
No single plot can reliably explain every decline. The strongest assessments integrate reservoir, wellbore, fluid, and facility evidence.
- Review oil, water, gas, and total-liquid trends, not oil rate alone.
- Compare pressure data with gauge conditions and shut-in history.
- Track choke size, flowing tubing pressure, separator pressure, and artificial-lift settings.
- Use pressure-transient tests, production logs, temperature logs, and flow-profile tools where justified.
- Check interventions, chemical treatments, workovers, and changes in produced-fluid chemistry.
Each dataset has uncertainty. Confidence increases when independent observations point to the same mechanism.
🧮 Decline Curves Are Useful but Not a Verdict
Decline-curve analysis summarizes production behavior and supports forecasting, but it does not directly reveal the physical cause of a rate change. A change in choke, downtime pattern, water breakthrough, lift performance, or workover can distort the trend.
Using decline curves without operational context can lead to a false depletion narrative. Conversely, rejecting decline analysis entirely loses a useful field-scale perspective.
Use it as one line of evidence, then test whether the implied mechanism matches pressure, fluid, and operating data.
⚠️ Common Diagnostic Mistakes
One common error is treating pressure support as proof that oil remains mobile to the well. Another is ordering stimulation before identifying whether the dominant restriction is scale in tubing, water influx, poor lift, or a facility bottleneck.
Other avoidable mistakes include:
- Comparing rates at different choke settings as if conditions were identical.
- Ignoring changes in water cut, gas-oil ratio, and flowing pressures.
- Assuming one well represents the whole reservoir.
- Interpreting short shut-in pressure data as fully stabilized reservoir pressure.
- Focusing on maximum rate instead of sustainable, controlled production.
🧰 Match the Remedy to the Restriction
Possible responses range from adjusting choke strategy and optimizing lift to cleaning tubing, removing scale, reperforating, isolating a water-producing interval, stimulating a damaged zone, or changing completion strategy. Reservoir management may also involve modifying injection patterns or surveillance plans.
None of these is universally correct. For example, stimulation may help true near-wellbore damage but can worsen water production if it improves communication with a water-bearing interval. Water shutoff can reduce unwanted water in one zone but may be ineffective against broad coning.
The best intervention follows a defensible mechanism, expected value, and operational risk review.
📡 Surveillance Turns Surprises Into Manageable Problems
Regular surveillance detects divergence before it becomes a major rate loss. Useful programs combine dependable rate allocation, routine pressure and temperature information, fluid sampling when conditions change, lift-performance monitoring, and clear records of well interventions.
Frequency should reflect well value, uncertainty, and changing conditions. More data is not automatically better; measurements must be reliable enough to influence decisions.
A disciplined surveillance loop is observe, interpret, act, and verify.
🤝 Reservoir and Production Teams Need a Shared Model
The cause of a decline often sits between specialties. Reservoir engineers may see changing drainage and pressure support; production engineers may identify a worsening outflow curve; completion and chemical teams may recognize scale or zonal communication.
A shared well model prevents competing partial explanations. It also makes assumptions visible: whether pressure is representative, whether water is coming from a specific zone, and whether the lift system is limiting the achievable drawdown.
Integrated thinking is especially valuable in mature fields, where several mechanisms can operate at once.
🎯 The Core Principle: Energy Must Meet a Usable Flow Path
Healthy reservoir pressure means energy may still exist, but it does not guarantee oil can reach the well and surface efficiently. Oil must remain mobile in the pore network, enter the completion, travel through the wellbore, and pass through the artificial-lift and surface system.
Rate falls whenever a material restriction develops along that chain, even if pressure remains relatively stable. Water and gas behavior, changing relative permeability, skin, reservoir heterogeneity, completion condition, lift performance, and surface backpressure are all plausible contributors.
The practical takeaway is to diagnose the entire production system rather than asking pressure data to answer a question it cannot answer alone.
Oil production can decline with healthy-looking reservoir pressure because pressure is only the driving force; sustainable rate depends on every part of the flow path remaining connected, mobile, and unconstrained. 🛢️📉🔍