
A well can appear healthy during a morning review: rates are close to plan, pressures look plausible, and the separators are operating normally. By the next production test, however, liquid handling has changed, the oil rate has softened, and someone is trying to decide whether the cause is the reservoir, the wellbore, the lift system, or the measurement itself.
This is a familiar production-engineering problem. Most wells do not fail in one dramatic moment. Their performance usually changes through small, connected signals: a rising water cut, a drifting flowing pressure, a changing gas-liquid ratio, an unstable pump load, or a test that no longer agrees with allocated production.
Detecting those signals early gives a team more options. It may allow a low-cost operating adjustment, a better-targeted surveillance test, or a planned intervention rather than an urgent workover.
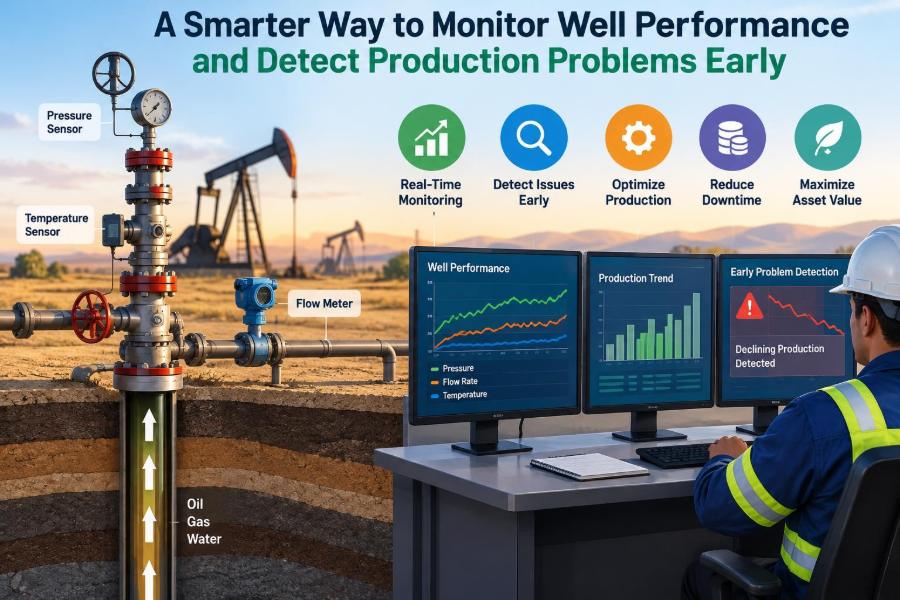
Smart monitoring is therefore not simply collecting more data. It is the disciplined process of converting reliable measurements into a working explanation of what the well is doing, what has changed, and what should be checked next.
🎯 The Real Purpose of Well Surveillance
Well surveillance is the routine observation and interpretation of well, reservoir, and surface-facility behavior. Its purpose is to protect safe operations and to identify production opportunities or threats while they are still manageable.
A good surveillance program answers practical questions: Is the well producing what its inflow potential suggests? Is artificial lift operating in its intended range? Has water or gas behavior changed? Is an apparent decline real, or is it a data-quality issue?
📉 Why Rate Alone Is Not Enough
Oil rate is an outcome, not a diagnosis. Two wells can show the same decline, while one is losing reservoir pressure and the other is restricted by scale, liquid loading, or a deteriorating pump.
Rate should be interpreted beside flowing pressure, choke setting, water rate, gas rate, operating status, and lift-system measurements. This context separates a genuine subsurface change from a change caused by the way the well is operated.
🧩 Start With a Well Performance Baseline
Early detection depends on knowing what “normal” means for each well. A baseline is not a single test result; it is an expected operating envelope developed from production history, well design, fluid properties, and known constraints.
Useful baseline elements include stabilized oil, water, and gas rates; flowing tubing-head pressure; choke size; line pressure; water cut; gas-oil ratio; and artificial-lift operating conditions. For intermittent or cyclic wells, the baseline must also capture cycle length and production pattern.
🗺️ Understand the Full Production System
A producing well is a connected system: reservoir, completion, tubing, lift equipment, wellhead, flowline, separation, and measurement. A restriction or pressure change at one point can alter behavior everywhere else.
This system view prevents a common mistake: assigning every rate loss to the reservoir. A higher separator pressure, for example, can reduce the pressure drawdown available to the well even when the reservoir and completion have not changed.
📏 Measure the Variables That Explain Change
Not every well needs every instrument, but each well needs enough information to distinguish the leading explanations for changing performance. Measurements should be chosen for the decisions they support.
- Rates: oil, water, gas, and total liquid, with a clear distinction between tested, metered, and allocated values.
- Pressures: tubing head, casing, line, separator, and where available, downhole flowing pressure.
- Operating state: choke position, valve status, downtime code, chemical injection, and lift settings.
- Equipment condition: pump speed, current, vibration, dynamometer data, injection pressure, or compressor behavior.
🔍 Treat Data Quality as an Engineering Task
Automation does not remove measurement uncertainty. A stuck pressure transmitter, an incorrect meter factor, a delayed manual entry, or a changing test separator condition can create a convincing but false trend.
Before escalating a production anomaly, check timestamps, units, instrument ranges, calibration status, communication gaps, and whether the well was stable when measured. Comparing independent measurements is often the fastest validation step.
🕒 Match Sampling Frequency to the Failure Mode
Daily production totals may reveal a gradual decline but can miss surging, gas interference, cycling, or short shutdowns. High-frequency data can expose these events, but it also creates more noise and more opportunities for false alarms.
The right frequency depends on risk. A critical electric-submersible-pump well may justify continuous monitoring, while a stable, low-rate well may be effectively managed with periodic tests and disciplined operating records.
📊 Build Trends, Not Isolated Snapshots
A single unusual reading deserves attention, but not necessarily a conclusion. Plotting variables over time reveals whether a change is persistent, cyclic, seasonal, or linked to an operational event.
Use consistent time scales and mark events such as choke changes, chemical treatments, shut-ins, workovers, and facility upsets. A trend becomes much more useful when the operational history is visible beside it.
🧮 Normalize Before Comparing Performance
Raw production rates are difficult to compare when choke size, flowing pressure, uptime, or separator conditions have changed. Normalization means adjusting the comparison so that unlike operating conditions are not mistaken for a reservoir or well problem.
For example, a lower oil rate after a choke reduction may be expected. A lower oil rate at the same choke and similar backpressure is more diagnostic, especially if tubing-head pressure and water cut are also changing.
💧 Watch Water Cut and Water Rate Together
Water cut is the fraction of produced liquid that is water, but it can rise even when water rate is flat if oil rate falls. Water rate shows the actual water-handling burden; water cut shows the changing fluid mix. Both matter.
A gradual water increase may reflect normal displacement, coning, channeling, or movement of injected water. A sudden jump may indicate a completion change, a casing or behind-pipe issue, or simply an unreliable test. The production context determines which possibilities deserve investigation.
🔥 Interpret Gas Behavior Carefully
Gas-oil ratio, or GOR, is often a valuable clue, but it is not self-explanatory. Rising GOR can result from reservoir gas liberation, gas coning, a leak, gas interference with a pump, or changing separator and allocation conditions.
Conversely, a falling reported GOR may indicate reduced gas production, but it may also reflect meter limitations at low rates. Pair gas data with pressure behavior, liquid rate, and the physical design of the well.
🌡️ Use Pressure as a System Diagnostic
Pressure measurements explain the energy available to move fluids. When tubing-head pressure rises while choke and line conditions appear unchanged, the source might be increasing downstream backpressure, a restriction, or altered lift performance.
Pressure data are most powerful when measured at multiple points. The difference between tubing-head and separator pressure, for instance, helps indicate whether a flowline or choke-related pressure loss is affecting the well.
🛢️ Read Inflow and Outflow Together
Inflow performance describes how the reservoir delivers fluids into the wellbore at different bottomhole pressures. Outflow performance describes the pressure required to lift those fluids through the completion, tubing, and surface system.
The operating point occurs where inflow and outflow meet. A well can lose rate because inflow has weakened, because outflow has become harder, or because both changed. Nodal analysis provides a structured way to test these competing explanations.
⚙️ Recognize Artificial-Lift Signatures
Artificial lift adds another layer of surveillance. The production trend must be read alongside the equipment’s operating signature, not separately from it.
| Lift method | Useful surveillance clues | Possible concern |
|---|---|---|
| Rod pump | Fluid level, pump card, polished-rod load, runtime | Gas interference, worn valves, tubing leak, pump-off |
| ESP | Motor current, intake pressure, frequency, vibration | Gas lock, solids, overheating, changing head requirement |
| Gas lift | Injection pressure/rate, casing pressure, valve response | Injection instability, valve issue, unloading problem |
| Plunger lift | Arrival time, cycle length, casing/tubing pressure | Liquid loading, poor sealing, controller settings |
These clues are indicators, not automatic diagnoses. Equipment data should lead to field verification or engineering analysis before an intervention is selected.
🪨 Separate Reservoir Decline From Wellbore Damage
A decline caused by lower reservoir pressure often affects neighboring wells in a broadly consistent way, although local geology can create exceptions. Wellbore damage or a completion restriction may appear as a more localized loss of productivity.
Pressure-transient testing, production logging, fluid-level surveys, and nodal modeling can help discriminate between these causes. The best method depends on well access, cost, risk, and the decision that must be made.
🧱 Look for Restrictions and Deposits
Scale, wax, asphaltenes, fines migration, and corrosion products can increase pressure loss or restrict inflow. Their signatures vary, but a falling rate accompanied by changing pressure relationships and no matching reservoir explanation should prompt consideration of a restriction.
Do not assume every restriction needs the same treatment. A chemical program, solvent, mechanical cleanout, or tubing intervention must match the deposit type, location, compatibility, and operational risk.
🌊 Identify Liquid Loading in Gas Wells
Gas wells need sufficient velocity to carry produced liquids to surface. When gas velocity falls below the well’s practical unloading requirement, liquids can accumulate, raise bottomhole pressure, and further reduce gas flow.
Common warning signs include erratic rate, increasing flowing pressure, periodic slugs, and improvement after unloading. Well geometry, fluid properties, and operating conditions matter, so simplified rules should be screened against actual well data.
🚧 Do Not Ignore Surface Constraints
Production loss may originate outside the well. High separator pressure, partially closed valves, flowline buildup, compressor limits, emulsions, or water-disposal restrictions can reduce throughput and distort the apparent well response.
When several wells in one gathering area change at once, start with common facilities and operating conditions. A field-wide pattern is often more informative than a detailed review of one well alone.
🚨 Design Alerts Around Meaningful Deviations
An alert should represent a departure from a well-specific expected range, not merely a universal rate threshold. A five-percent fluctuation may be normal for one well and significant for another.
Useful alerts combine persistence, magnitude, and context. For example, a sustained fall in liquid rate combined with higher tubing-head pressure and stable choke position is more actionable than a single low daily value.
🧠 Use Analytics to Prioritize, Not Replace Judgment
Statistical methods and machine-learning tools can detect unusual patterns across many tags and wells. They can rank wells for review, identify correlated changes, and reduce the time spent scanning routine data.
They cannot reliably resolve missing operational context by themselves. A model may flag a pump anomaly without knowing that the well was intentionally slowed for a facility constraint. Human review, field knowledge, and sound physics remain essential.
🧪 Confirm a Hypothesis With the Right Test
After identifying an anomaly, write a short hypothesis: what changed, what mechanism might explain it, and what observation would support or weaken that explanation. This avoids collecting data without a decision pathway.
- Suspected allocation error: compare test, meter, separator, and tank information.
- Suspected pump issue: review operating data, fluid level, and applicable diagnostic surveys.
- Suspected formation-water entry: confirm trends, consider production logging, and examine nearby injector behavior.
- Suspected flowline restriction: compare pressures along the route and inspect operating conditions.
🛠️ Prioritize Actions by Value and Risk
Not every anomaly warrants an immediate intervention. Rank opportunities according to expected production impact, confidence in the diagnosis, safety exposure, cost, probability of success, and consequences of waiting.
A low-risk action such as correcting a choke setting or restoring chemical injection may be justified quickly. A major workover should normally require stronger evidence because it can introduce downtime and mechanical risk.
👷 Create Clear Roles and Escalation Paths
Surveillance fails when anomalies sit in a dashboard without ownership. Operators, production engineers, reservoir engineers, maintenance personnel, and data specialists need a defined path for reviewing, assigning, and closing findings.
A practical daily or weekly review can classify items as data issue, operating adjustment, further diagnosis, planned maintenance, or intervention candidate. Recording the final cause also improves future pattern recognition.
📝 Keep an Event and Decision Log
A concise event log turns scattered observations into organizational memory. Record when a trend began, which data were checked, what action was taken, and how the well responded.
This record is especially valuable when teams change or when the same symptom returns months later. It also reveals whether repeated fixes are treating a root cause or merely managing its symptoms.
⚠️ Avoid Common Surveillance Traps
The most damaging mistakes are often interpretive rather than technical. They include reacting to one noisy point, trusting allocations without checking tests, comparing wells under different constraints, and treating correlation as proof of cause.
Another trap is “dashboard comfort”: assuming a displayed value is correct because it is easy to see. Data visibility is useful only when measurement quality and engineering meaning are assessed together.
🔄 Use Closed-Loop Learning
Every action is an experiment of sorts. If a choke adjustment, cleanup, pump-speed change, or chemical treatment is made, define beforehand what response is expected and how long it should take to appear.
Then compare the result with the expectation. If the expected response does not occur, revise the hypothesis rather than repeatedly applying the same remedy. This closed-loop approach steadily improves the field model.
📚 A Practical Daily Review Routine
A short, consistent routine is usually more valuable than an occasional deep dive. Start by screening uptime, safety-related alarms, major rate deviations, pressure changes, lift exceptions, and facility constraints.
Next, distinguish measurement problems from probable physical changes. Finally, assign the few items that need action, specify the next check, and set a review date. The goal is not to investigate every fluctuation; it is to prevent meaningful changes from becoming invisible.
🏁 The Core Principle: Connect Data to Decisions
Smarter well monitoring is not defined by the number of sensors, charts, or algorithms in use. It is defined by whether the available information helps a team recognize deviation, test a credible explanation, and choose a proportionate action.
Reliable data, well-specific baselines, system thinking, and disciplined follow-up form the foundation. When these elements work together, production surveillance becomes an early-warning process rather than a retrospective explanation for lost performance.
The most effective well surveillance detects change early by connecting trustworthy measurements to the physics of the entire production system and to a clear next decision. That habit protects production potential while making interventions more deliberate, safer, and easier to justify. 🛢️📈🔧