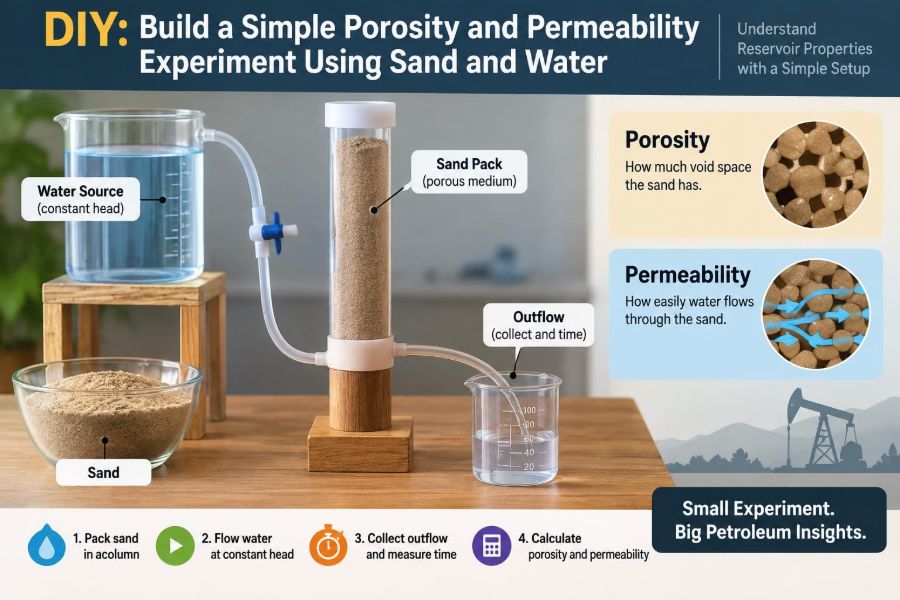

A jar of sand can look solid enough to stand on, yet it contains a connected maze of tiny openings. In a petroleum reservoir, those openings are where oil, gas, and water reside and move.
That difference between what a rock can hold and what it can transmit sits at the center of reservoir engineering. Porosity describes storage space; permeability describes the ease of flow through that space.
You do not need a core laboratory to see the distinction. With sand, water, a clear container, and careful measurements, you can build a useful physical model that turns two abstract properties into observations.
This experiment will not produce certified reservoir data, and sand is not a complete substitute for consolidated rock. It can, however, teach the measurement logic, sources of uncertainty, and geological reasoning behind porosity and permeability tests.
🧭 The reservoir question behind the experiment
Petroleum engineers ask two linked questions about a reservoir interval: How much fluid can the pore system store? and How readily can that fluid move toward a well? A formation may answer one question favorably and the other poorly.
Consider two hypothetical sand packs of the same external size. One could contain many voids but have narrow, poorly connected pathways. The other may have slightly less empty space but broader channels that let water pass quickly. The first may have higher porosity, while the second has higher permeability.
Your sand-and-water model makes this contrast visible without pretending that all subsurface behavior is simple.
🫙 What porosity actually measures
Porosity, usually written as φ, is the fraction of a bulk sample volume occupied by pore space. It is dimensionless and is commonly reported as a decimal or percentage.
The basic relation is:
φ = pore volume / bulk volume
Bulk volume includes both solid grains and the spaces between them. If a 500 mL sand pack has 175 mL of connected pore space, its measured porosity is 0.35, or 35%.
In this home experiment, water entering a dry, air-filled pack estimates the accessible pore volume. It is therefore a practical measurement of connected, water-accessible voids rather than a complete description of every microscopic pore.
💧 What permeability actually measures
Permeability is a material property describing how easily a fluid can flow through an interconnected pore network when a pressure difference exists. It is not simply the speed you observe; flow rate also depends on the fluid, sample length, cross-sectional area, and driving pressure.
In petroleum engineering, permeability is often expressed in darcies or millidarcies. A DIY setup is unlikely to measure an accurate absolute value in those units because pressure and geometry are difficult to control precisely.
It can still provide a powerful relative permeability comparison: under the same apparatus and procedure, which sand pack transmits water faster?
🔗 Why pore space and flow are not the same thing
A useful analogy is a building. Porosity is like the total floor area inside rooms; permeability is like how easily people can move between rooms through doors and hallways. Large rooms do not help movement if the doors are narrow or blocked.
Likewise, a sample can have considerable pore volume but low permeability if pore throats—the narrow constrictions joining larger pores—are small. Clay, silt, cement, and poorly connected pores often restrict flow.
This is why engineers avoid assuming that high porosity automatically means high productivity.
🧱 Why sand is a useful, limited model
Clean sand has visible grains, manageable pore spaces, and usually enough permeability for gravity-driven water flow. It makes packing, grain size, and fines effects easy to observe.
Real reservoir rocks are more complicated. They may contain cemented grains, mineral dissolution features, fractures, clays that swell or retain water, multiple fluid phases, and pores much smaller than those in ordinary sand.
Use this activity as a conceptual model. It reproduces the core ideas of void volume and flow resistance, but it does not replace core analysis, wireline logs, or reservoir testing.
🧰 Materials for a repeatable setup
Choose clear, inexpensive items that let you measure volumes and times consistently. The most important feature is not sophistication; it is controlling the setup from one test to the next.
- A clear straight-sided bottle or transparent tube
- Clean sand, ideally in two or three grain-size groups
- A measuring cup, graduated cylinder, or syringe with volume markings
- Water, plus optional food coloring for visibility
- A funnel
- A ruler and permanent marker
- A stopwatch or phone timer
- Coffee filters, mesh, or clean cloth to retain sand
- Rubber bands or tape to secure the filter
- A receiving cup and a notebook or spreadsheet
A cut plastic bottle can work, but a tube with a nearly constant internal diameter is better because its cross-sectional area changes less with height.
🦺 Safety and practical housekeeping
Use clean sand rather than material collected from uncertain locations. Outdoor sand may contain organic matter, sharp fragments, or fine particles that create messy and inconsistent results.
Cutting plastic requires care. If an adult is supervising a class or home activity, that person should cut the bottle and check that the filter is secure before water is poured.
Work over a tray or sink. Wet sand is slippery, and discarded sand should go into a container or trash rather than down a drain, where it can settle in plumbing.
📏 Build a simple vertical flow column
Make a small outlet at the bottom of the bottle or use the bottle neck as the outlet. Cover it from the inside with a coffee filter or fine mesh, then secure the material so that sand cannot escape while water can drain.
Mount the column upright over a receiving cup. A stable arrangement matters: changing its tilt can rearrange grains and alter the pathways that control flow.
Mark two lines on the outside: a lower line near the bottom of the sand bed and an upper line that defines the target sand height. These marks help you prepare comparable samples.
🏖️ Prepare the sand before measuring
Dry sand simplifies the first porosity test because the water volume added can be tracked directly. Spread washed sand in a shallow tray and let it air-dry before use if it was previously wet.
Remove obvious leaves, shells, or debris. If you want a cleaner grain-size comparison, pass sand through kitchen sieves or mesh screens and retain separate coarse and fine fractions.
Do not assume two bags labeled “sand” are comparable. Grain shape, size range, dust content, and moisture can all change the result.
📦 Define the bulk volume of the sand pack
Fill the column with dry sand to the upper mark. Avoid pressing hard with a tool during the baseline test; instead, use one chosen preparation method for every sample.
If the internal cross-sectional area is known, bulk volume can be estimated from area multiplied by bed height. A more accessible approach is to calibrate the container: add measured water to the empty column up to the same height mark and record that volume.
That calibrated volume represents the external volume occupied by the future sand pack. Drain and dry the column before adding sand.
🧊 Pack consistently, because packing changes results
Pouring sand loosely produces one arrangement of grains. Tapping the column settles grains into a denser arrangement, generally reducing the total void space. Both are valid conditions, but they should not be mixed within a comparison.
For a basic protocol, pour sand through a funnel from roughly the same height, level the top gently, and tap the column a specified number of times. Record that number.
Consistency turns a demonstration into an experiment. If the preparation changes invisibly between trials, differences in flow time may reflect packing rather than the sand type being studied.
🧪 Measure accessible pore volume with water
Close or temporarily block the outlet. Slowly add measured water to the dry sand until the water level just reaches the top of the sand pack. Pour near the wall or use a small stream to reduce disturbance.
Pause occasionally so trapped air can escape. The total volume of water that enters before a standing water layer forms is your estimate of accessible pore volume.
If water drains through the outlet despite your blockage, the porosity volume will be underestimated. Check the seal before restarting rather than trying to correct an uncertain measurement afterward.
➗ Calculate porosity step by step
Use the water-filled pore volume and the calibrated bulk volume:
porosity (%) = (water volume entering pores / bulk volume of sand pack) × 100
Suppose an empty column holds 400 mL to the marked height. After packing it with dry sand by your chosen procedure, 132 mL of water enters before the water reaches the top. The estimated porosity is:
(132 / 400) × 100 = 33%
This is a hypothetical calculation. Report sensible precision, such as 33% rather than 33.247%, because measuring cups and sand packing do not justify many decimal places.
🌬️ Watch for trapped air
Air bubbles can prevent water from reaching otherwise connected pores, causing a low apparent porosity. They are especially common when water is poured quickly into fine sand or when the outlet is tightly closed.
Adding water slowly and tapping the side lightly can help bubbles migrate upward. Some laboratory methods use vacuum saturation to remove air far more effectively, but that is beyond the purpose of this simple setup.
Write down whether bubbles were visible. Observations like this explain variation better than a bare number does.
⏱️ Turn the column into a flow experiment
For a basic permeability comparison, first saturate the sand pack with water. Then maintain water above the top of the sand and allow flow out of the bottom into a measuring cup.
Start timing when you open the outlet or when the water level reaches a defined reference mark. Collect a chosen volume, such as 100 mL, and stop the timer when that volume is reached.
Keeping the water level range similar between tests matters because the height of water creates the driving pressure in this gravity-fed system.
📐 Understand the driving force: hydraulic head
Water flows through the sand because gravity creates a pressure difference between the water above the pack and the outlet. In groundwater work, this energy difference is commonly described as hydraulic head.
A taller water column produces a larger driving force and can increase flow rate even if the sand itself is unchanged. Therefore, comparing runs with different water heights does not isolate permeability.
For a fair classroom-style comparison, start each run at the same water level and collect the same volume over the same defined portion of the test.
📊 Calculate flow rate, not permeability in darcies
Calculate average flow rate using:
flow rate = collected water volume / elapsed time
If 100 mL is collected in 20 seconds, the average flow rate is 5 mL/s. If another sample yields 100 mL in 80 seconds under matching conditions, it has a much lower flow rate.
It is tempting to call this number permeability, but that would be inaccurate. It is a system response influenced by the sand, water head, outlet, sample dimensions, and filter. Describe it honestly as an apparent flow-rate comparison.
📜 The connection to Darcy’s law
Darcy’s law is the foundational relation for slow, viscous flow through porous media. In one common form, it relates flow rate to permeability, cross-sectional area, pressure difference, fluid viscosity, and flow length.
Q = (kA/μ) × (ΔP/L)
Here, Q is flow rate, k is permeability, A is cross-sectional area, μ is fluid viscosity, ΔP is pressure difference, and L is sample length. The negative sign often shown in formal versions indicates that flow moves from higher to lower pressure.
Your experiment holds only some of these quantities approximately steady. That is enough to demonstrate the direction of the relationship, but not enough for reliable absolute k values.
🌊 Keep the flow regime sensible
Darcy’s law is most applicable when flow through pores is orderly and dominated by viscous resistance. Very fast flow through coarse media can introduce inertial effects, making the flow rate no longer proportional to the pressure difference.
A small gravity-fed experiment should use a modest, steady water head rather than forceful squeezing, pumping, or shaking. Let the water drain naturally.
If the outlet alternates between spurting and stopping, inspect for air locks, a shifting filter, or a blocked opening before interpreting the data.
🪨 Compare coarse and fine sand
Prepare two columns with equal bed height and the same packing protocol: one with coarse sand and one with fine sand. Measure porosity and the time to collect a fixed water volume.
Coarse sand often drains faster because its pore throats tend to be larger. Fine sand often drains more slowly because water encounters narrower passages and greater resistance.
Porosity may not change in the same direction or by the same amount. Similar-sized, well-packed spherical grains can have comparable porosity despite very different grain diameters. The flow result is usually the clearer contrast.
🧩 Test sorting and mixed grain sizes
Sorting describes how uniform grain sizes are. Well-sorted sand has grains of similar size; poorly sorted sand contains a broad mixture.
When small grains occupy spaces between large grains, total pore volume can fall. More importantly for flow, those small grains can narrow or block the larger pathways.
Try a comparison between well-sorted coarse sand and a mixture of coarse sand with a measured portion of fine sand. Keep the bulk height constant, and treat the mixed sample as a separate material rather than a minor adjustment.
🧱 See the effect of compaction
Using the same sand, prepare one loosely poured pack and one pack settled by repeated gentle taps. Measure each condition independently.
Compaction generally brings grains into a tighter arrangement, reducing void volume. It can also alter the geometry and connectivity of flow pathways, often lowering the observed flow rate.
In reservoirs, burial and stress can compact sediments over geological time. Cementation can reduce pore space further by growing minerals in the voids, an effect that loose sand alone does not fully reproduce.
🧹 Add fines carefully to model plugging
A small amount of silt-like material, very fine sand, or clean clay substitute can dramatically change drainage. The fine particles may lodge in pore throats and restrict connections between larger pores.
This is a useful model of fines migration, but handle the interpretation carefully. Real clay minerals can also react chemically with water, swell, disperse, or retain bound water; ordinary household materials do not necessarily reproduce those processes.
Use small, recorded additions and clean the apparatus between tests. Otherwise, residual fines can contaminate every later sample.
🧾 Design a fair comparison
A comparison becomes meaningful only when you change one main variable at a time. If you switch sand type, pack height, water temperature, and outlet size all at once, the result cannot identify the cause.
- Keep the same column and filter arrangement.
- Use the same bed height and approximately the same cross-sectional area.
- Start from the same water level.
- Collect the same target volume.
- Use water at roughly the same temperature.
- Apply the same packing rule.
- Run each condition more than once.
This is the experimental discipline behind much more advanced core-flood and petrophysical work.
🗒️ Build a field-style data sheet
Record measurements immediately rather than trusting memory. A simple table turns a collection of wet jars into evidence you can review, graph, and discuss.
| Run | Sand description | Packing method | Bulk volume | Pore-water volume | Porosity | Collection time | Observations |
|---|---|---|---|---|---|---|---|
| 1 | Coarse, well sorted | 10 gentle taps | Record | Record | Calculate | Record | Bubbles, cloudiness, channeling |
| 2 | Fine, well sorted | 10 gentle taps | Record | Record | Calculate | Record | Bubbles, cloudiness, channeling |
Include qualitative notes. Cloudy discharge, a visible crack along the wall, or settling during a run can be as informative as the final time.
🔁 Repeat trials and interpret scatter
Repeat each condition at least a few times when practical. A single run can be distorted by a trapped bubble, a slightly different water level, or an unnoticed shift in the outlet filter.
Do not discard an unusual result merely because it is inconvenient. First look for a documented procedural reason. If no cause is clear, report the range and state that the setup has variability.
For small experiments, the average is useful, but the spread between trials is also evidence of measurement uncertainty.
⚠️ Common mistakes that distort results
Several errors recur in simple porous-media tests:
- Changing the pack height: a longer flow path adds resistance.
- Using different water heads: a larger head raises the driving force.
- Letting sand escape: the filter and sample geometry change during the run.
- Comparing dry and saturated flow: initial wetting behavior is not steady saturated flow.
- Ignoring temperature: water viscosity changes with temperature, affecting flow.
- Overpacking one sample: packing can dominate the apparent material difference.
A careful note about limitations is stronger engineering than an overly confident conclusion.
🛤️ Recognize channeling and wall effects
Water often prefers the easiest route. In a transparent column, you may see a fast path along the wall, a crack, or a loosely packed region. This is called preferential flow or channeling.
Channeling can make a sample appear more permeable than the bulk sand truly is. It is especially likely in wide containers, uneven packing, or samples disturbed by rapid filling.
To reduce it, use a narrower uniform column, pour steadily, avoid scraping large voids along the wall, and distribute inflow gently across the top.
🧬 Why saturation changes the story
During the porosity fill, water displaces air. During a flow test, the pore space may still contain trapped air, especially after rapid wetting. That means water does not necessarily occupy every connected pore.
Reservoirs commonly contain more than one fluid phase as well: oil, gas, and water compete for pore space. Their movement is controlled by saturation, wettability, capillary pressure, and relative permeability—not just by absolute permeability of the rock.
Your water-only test isolates one part of a much larger multiphase-flow problem.
🧲 Capillary effects in small pores
Capillary forces arise from the interaction of fluids with solid surfaces and from surface tension. In narrow pores, these forces can hold water against gravity or resist displacement by another fluid.
Fine sand may remain wet for longer after drainage because its smaller pores generate stronger capillary effects. This does not automatically mean it has high permeability; in fact, the same small throats often reduce flow.
A simple observation after the main test is to compare how much water remains in coarse and fine samples after equal drainage time. Treat it as qualitative evidence, not a precise saturation measurement.
🧠 Connect observations to reservoir quality
Reservoir quality is not a single number. It reflects whether a rock has enough effective pore volume to store hydrocarbons and enough connected flow capacity to deliver them at useful rates under reservoir conditions.
A rock with good porosity but poor permeability may contain fluid that is difficult to produce. A highly permeable zone with limited thickness or low hydrocarbon saturation may also be less valuable than its permeability alone suggests.
This is why petrophysical interpretation combines porosity, saturation, permeability estimates, lithology, pressure behavior, and geological continuity.
🧭 Extend the experiment without losing control
Once the baseline works, add one controlled extension at a time. You might compare angular crushed sand with rounded sand, vary the amount of fines, test different packing energy, or change bed length while holding sand type constant.
You can also plot collected volume against time for each sample. A straighter, steeper trend during a steady period indicates a higher and more consistent flow rate under that test condition.
Do not expand into oils, solvents, or pressurized equipment for a home setup. Water gives enough complexity for sound learning while avoiding unnecessary handling and cleanup risks.
📚 What laboratory core analysis adds
Professional core analysis uses prepared rock plugs, controlled confining conditions, calibrated pressure systems, carefully measured fluid properties, and procedures designed to control saturation. Laboratories may measure grain density, bulk volume, helium porosity, brine permeability, and multiphase properties.
Those measurements are paired with core description and well logs. Even then, scale matters: a small plug may not capture fractures, laminations, or heterogeneity across an entire reservoir interval.
The DIY column teaches the same intellectual habit: define the sample, control conditions, measure inputs and outputs, and state what the result can and cannot support.
📝 A concise way to report your findings
A strong report identifies the question, apparatus, procedure, results, and limitations. For example: “Under equal bed height and starting water level, the coarse sand produced a higher average water flow rate than the fine sand. The porosity estimates were not sufficient by themselves to predict the flow difference.”
Then explain plausible mechanisms: larger pore throats, fewer fine particles, or less compaction. Avoid claiming a mechanism you did not observe directly as certain.
Finish by naming uncertainties, such as trapped air, uneven packing, outlet resistance, and limited measurement resolution.
🎯 The core takeaway: storage needs pathways
The experiment reduces reservoir behavior to a clear physical lesson. Water can enter empty spaces between sand grains, revealing pore volume, but it can only drain efficiently when those spaces connect through sufficiently open pathways.
Porosity answers the storage question. Permeability addresses flow capacity. Grain size, sorting, compaction, fines, saturation, and the pressure gradient all influence what you observe.
The most useful result is not a single number. It is the ability to look at a porous material and ask the engineering questions behind it: how much void space exists, how well is it connected, and what conditions are driving fluid through it?
A simple sand column shows the central reservoir principle: fluids require both pore space to reside in and connected pathways to move through. Build carefully, compare fairly, and let the unexpected bubbles, slow drains, and shifting grains sharpen your engineering judgment. 🛢️💧🔬