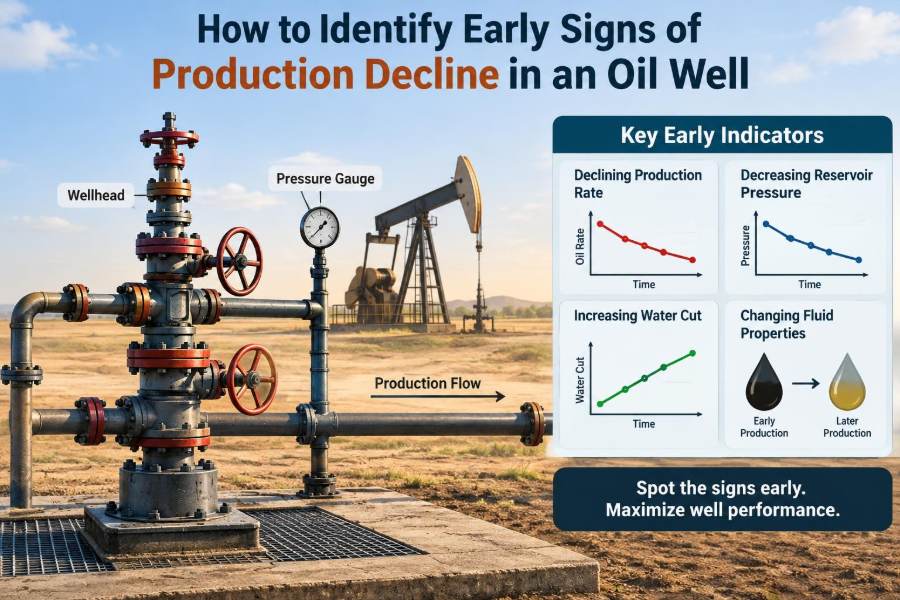

A well can look stable on the morning report and still be moving into decline. The first clues are often small: a slightly lower oil rate, a longer unloading time after a shut-in, more water in the test separator, or a pump that runs a little differently than it did last month.
For an operator, these changes affect production targets, operating costs, equipment decisions, and reserve estimates. For an engineer, they raise a more difficult question: is the reservoir delivering less energy, or is the well and its surface system preventing fluids from reaching the sales line efficiently?
The distinction matters. A true reservoir-driven decline may be expected and managed through forecasting and recovery planning. A mechanical restriction, liquid loading problem, or inaccurate measurement may be recoverable if recognized early.
Early decline detection is therefore not about reacting to one low reading. It is about building a reliable picture from rates, pressures, fluid properties, equipment behavior, and operating history before a minor deviation becomes a costly loss of production.
🧭 Start With the Meaning of Production Decline
Production decline is a sustained reduction in a well’s deliverable oil, gas, or total fluid rate under comparable operating conditions. It is not simply a lower number on a daily report.
A well may produce less because the reservoir pressure is falling, the producing interval is becoming less productive, water is occupying more of the flow path, or artificial lift is no longer matched to the well. Surface restrictions and measurement errors can create the same apparent symptom.
📉 Distinguish a Trend From Normal Variability
Daily production naturally moves up and down. Separator conditions, test duration, choke adjustments, line pressure, weather, downtime, and recent well interventions can all affect a reported rate.
A useful early-warning approach compares several data points collected under similar conditions. If oil rate is lower across repeated stabilized tests while choke setting, flowing pressure, and operating time are comparable, the signal is stronger than a single low test.
🗂️ Establish a Trustworthy Baseline
Every well needs a reference condition. The baseline should include stabilized oil, water, and gas rates; flowing tubing and casing pressures where available; choke size; flowing temperature; artificial-lift settings; and key separator conditions.
Without that context, a rate cannot be interpreted properly. A rate of 200 barrels per day may indicate a healthy mature well in one field and a serious underperformance in another.
🧪 Verify the Measurement Before Diagnosing the Well
Production data can be wrong for ordinary reasons: a faulty meter, an unrepresentative well test, incorrect allocation, a leaking test valve, or a separator that has not reached stable conditions.
Before recommending a workover, validate the basics. Compare test data with tank volumes, multiphase-meter trends where installed, neighboring production behavior, and historical test quality. A bad measurement can imitate a bad well.
⏱️ Watch the Stabilized Oil Rate
The clearest early indicator is often a repeatable fall in stabilized oil rate. “Stabilized” means the rate is measured after transient effects from start-up, shut-in, choke movement, or test-line switching have largely settled.
Short tests can overstate or understate performance. A well that takes longer than usual to stabilize may itself be providing useful diagnostic information, particularly when liquid loading or artificial-lift limitations are possible.
💧 Track Water Cut, Not Just Water Volume
Water cut is the fraction of produced liquid that is water. A rising water cut can reduce oil output even when total liquid rate appears steady, making a well look productive while its oil contribution declines.
An increase may reflect advancing reservoir water, coning from an aquifer, channeling behind pipe, a fracture-connected water source, or changes in completion flow distribution. It does not identify the cause by itself, but it changes the diagnostic path.
🌬️ Interpret Changes in Gas-Oil Ratio Carefully
Gas-oil ratio, commonly called GOR, is the produced gas volume relative to oil volume under defined reporting conditions. A rising GOR can occur as reservoir pressure falls below bubble point and gas evolves from oil, but it can also indicate gas coning, gas breakthrough, or changing lift-gas behavior.
A falling GOR is not automatically positive. In some wells it may accompany liquid loading, reduced gas deliverability, separator problems, or a shift in the producing zones. Always assess GOR beside pressure and fluid-rate trends.
🧮 Read Total Fluid Rate Alongside Oil Rate
Oil rate alone can conceal the mechanism of decline. If total liquid rate falls with oil rate, the well may have a productivity or lift problem. If total liquid stays similar while water rises, displacement of oil by water is a more plausible explanation.
| Observed pattern | Possible interpretation | Useful follow-up |
|---|---|---|
| Oil and total liquid both decline | Lower inflow, restriction, or lift limitation | Compare pressures and equipment performance |
| Oil declines while total liquid is steady | Increasing water contribution | Review water cut and zone behavior |
| Oil declines while gas rises sharply | Gas interference or gas breakthrough | Review GOR, drawdown, and lift response |
| Reported rate changes abruptly | Operational or measurement change | Check tests, downtime, choke, and facilities |
🧱 Compare Flowing Tubing and Casing Pressures
Flowing tubing pressure reflects resistance between the reservoir and surface equipment. Flowing casing pressure can provide clues about annular behavior and, in some completions, gas availability for lift.
A falling production rate with rising tubing pressure may point toward increased backpressure, a restriction, or deteriorating lift efficiency. A rate decline with lower pressures can be consistent with weaker reservoir support, although the interpretation depends on choke position and operating configuration.
🎯 Examine Drawdown Rather Than Pressure Alone
Drawdown is the difference between reservoir pressure and flowing bottomhole pressure. It is the pressure force that drives fluids into the wellbore.
If a well needs progressively greater drawdown to maintain the same rate, productivity may be deteriorating. If drawdown increases but rate still falls, the near-wellbore region, fluid mobility, water or gas interference, or artificial lift may be limiting performance.
🛢️ Recognize Reservoir Pressure Depletion
In a depletion-driven reservoir, pressure gradually declines as fluids are produced. This commonly reduces the energy available to move oil toward the well and lift it to surface.
Pressure depletion is often expected, but its rate may differ among wells because of permeability variation, compartmentalization, production history, or pressure support from injection. Periodic pressure surveys and carefully interpreted buildup data help separate field-wide depletion from a localized well problem.
🧽 Look for Near-Wellbore Damage
Near-wellbore damage is a reduction in flow capacity close to the well. It can result from fines migration, scale, wax, emulsion blockage, drilling or completion-fluid effects, and formation plugging.
A damaged well can show declining rate despite adequate reservoir pressure. In practical terms, the reservoir may still contain movable fluids, but the last few feet near the well act like a partially clogged filter.
🪨 Consider Scale, Wax, and Solids Deposition
Mineral scale can form when produced-water chemistry and pressure-temperature changes favor precipitation. Wax can deposit as crude cools below conditions where heavier components remain dissolved. Sand, corrosion products, and fines can also restrict flow.
Early signs include increasing pressure drop, declining rate at unchanged operating settings, erratic pump loads, reduced valve performance, or evidence from samples and intervention history. The right treatment depends on the deposit type; applying a generic chemical treatment without diagnosis can waste time and create handling risks.
🚰 Detect Water Breakthrough and Coning
Water breakthrough occurs when water reaches a producing well from an aquifer, injected-water pathway, high-permeability streak, fracture, or behind-casing channel. Water coning is the upward movement of water toward a completion caused by pressure drawdown.
A rapid water-cut increase can suggest a direct pathway, while a gradual increase may reflect broader encroachment. These are only patterns, not proof. Production logging, tracer work, pressure behavior, and completion information may be needed to locate the source.
🔥 Identify Gas Breakthrough and Gas Coning
Gas can enter a well from a gas cap, a gas-injection pathway, a high-permeability interval, or gas evolving as pressure declines. High gas production may reduce oil production by lowering liquid relative permeability or by interfering with pump intake performance.
Gas coning becomes more likely when drawdown is aggressive near a gas-oil contact. Reducing drawdown can sometimes improve oil efficiency, but it may also lower gross rate, so the operating choice requires economic and reservoir context.
⚙️ Treat Artificial Lift as Part of the Production System
Artificial lift does not create reservoir fluids; it reduces the flowing bottomhole pressure or assists lifting fluids to surface. When lift performance changes, the well may appear to be declining even if reservoir inflow has changed little.
Engineers should review the well as a connected system: reservoir inflow, completion, tubing, pump or gas-lift equipment, flowline, separator, and sales constraint. Optimizing one component while ignoring another can shift the bottleneck rather than remove it.
🔩 Spot Early Warning Signs in Rod-Pumped Wells
For rod-pumped wells, declining fluid production may be accompanied by changes in dynamometer-card shape, pump fillage, polished-rod load, fluid pound, increased run time, or unusual electrical behavior. A partially filled pump often signals inadequate fluid entry, gas interference, or pump capacity mismatch.
Mechanical failures are possible, but not every poor card means broken equipment. Fluid level measurements, pump intake pressure estimates, and repeat cards help distinguish a mechanical issue from a changing inflow condition.
🌀 Assess Electric Submersible Pump Performance
Electric submersible pumps, or ESPs, are sensitive to operating point, gas handling, solids, scale, temperature, and electrical conditions. A decline in rate paired with changing amperage, frequency, intake pressure, or vibration trends deserves prompt review.
Running an ESP far from its efficient operating range can increase recirculation, heating, and wear. Yet changing speed simply to chase rate can worsen gas interference or draw down the well too aggressively, so pump adjustments should be modeled and monitored.
💨 Evaluate Gas-Lift Wells for Instability
Gas lift performance depends on injection-gas availability, injection pressure, valve operation, depth of injection, fluid gradient, and the well’s response to lift rate. A small change in injection conditions can produce a noticeable rate change.
Signs of trouble include unstable casing pressure, heading flow, reduced response to injection-gas changes, or production losses after compressor or allocation changes. A valve-performance review and injection-rate verification are often more informative than assuming reservoir decline.
🌊 Recognize Liquid Loading in Flowing Wells
Gas wells and high-GOR oil wells may lose the gas velocity needed to carry liquid upward. Liquid then accumulates in the tubing, increasing hydrostatic pressure and reducing gas flow further.
Early signs can include cycling production, increased flowing pressure behavior inconsistent with the rate, longer recovery after shut-in, and a widening gap between short-term tests and sustained deliverability. The mechanism should be confirmed before selecting unloading, velocity-string, plunger, or lift options.
🚧 Check Surface Backpressure and Flowline Constraints
A well may be healthy underground but constrained at surface. Higher separator pressure, partially closed valves, plugged filters, hydrates, emulsion, a restricted flowline, or downstream compressor limitations can raise backpressure and reduce deliverability.
Compare wellhead pressure with separator pressure and review recent facility changes. If several wells on the same system decline together, a shared surface constraint may be more likely than simultaneous reservoir deterioration.
🧰 Use Well Tests That Answer a Specific Question
A well test is most useful when its purpose is clear. Is the objective to verify allocation, establish a stabilized rate, assess water cut, determine sensitivity to choke size, or compare performance before and after an intervention?
Good practice includes recording test duration, choke setting, separator conditions, operating status, and any unusual behavior. A test number without its conditions is difficult to compare with historical data.
📈 Build Decline Curves With Operational Context
Decline-curve analysis fits production history to a trend and is widely used for forecasting. It can help identify departures from expected behavior, but it is not a substitute for diagnosing the well.
Shut-ins, facility constraints, changing choke settings, workovers, and changing water cut should be identified before fitting a trend. A mathematical curve can describe reduced production, but it cannot independently determine whether the cause is depletion, scale, lift failure, or measurement error.
🧠 Combine Surveillance Data Instead of Chasing One Signal
The most reliable diagnosis usually comes from converging evidence. A falling oil rate, rising water cut, stable total liquid rate, and unchanged lift settings point in a different direction from a falling fluid rate, rising tubing pressure, and deteriorating pump fillage.
Simple surveillance dashboards can be effective when they show trends rather than isolated values. Useful signals include rate, uptime, water cut, GOR, pressures, temperatures, lift settings, power use, test quality, and recent operating events.
🔍 Use Diagnostics to Narrow the Cause
When routine data suggest a real change, targeted diagnostics can reduce uncertainty. The appropriate tool depends on the suspected mechanism and well configuration.
- Fluid-level surveys can support rod-pump and inflow assessments.
- Pressure-transient tests can provide information about reservoir and near-wellbore behavior, subject to test quality and interpretation limits.
- Production logs can help identify contributing intervals and unwanted water or gas entry.
- Samples and deposit analysis can distinguish scale, wax, corrosion products, and formation solids.
- Flowline and facility inspections can confirm surface restrictions.
No single diagnostic is universally decisive. Results should be interpreted with completion records and production history.
🧾 Investigate Abrupt Declines Differently From Gradual Ones
A sudden rate drop often points first to an operational, mechanical, surface, or measurement event: a valve position change, equipment trip, pump failure, line restriction, loss of lift gas, or test problem.
A gradual decline is more consistent with depletion, evolving water or gas behavior, deposition, or slowly changing lift performance. This is a screening rule, not a guarantee; a rapid water channel or sudden sand event can also produce an abrupt loss.
🗓️ Separate Downtime From Lost Deliverability
Monthly production can decline because the well produced fewer hours, even if its instantaneous rate did not change. A pump trip, power outage, planned maintenance, or facility shutdown should be recorded separately from well deliverability.
Track both volume and uptime-adjusted rate. Otherwise, a reliability problem may be mislabeled as reservoir decline, leading to an incorrect forecast and an ineffective intervention plan.
⚠️ Avoid Common Interpretation Mistakes
Several habits repeatedly create poor diagnoses:
- Comparing rates measured at different choke settings or separator pressures.
- Responding to one data point without checking test quality.
- Assuming rising water cut always means an irreparable reservoir problem.
- Increasing drawdown before checking whether gas or water coning is developing.
- Treating artificial-lift alarms as proof of equipment failure without evaluating inflow.
- Forecasting from raw production volumes without accounting for downtime and interventions.
These errors are understandable because well systems are coupled. The remedy is a disciplined comparison of like with like.
🛠️ Choose Interventions Only After a Root-Cause Review
Possible responses range from choke adjustment and chemical treatment to pump optimization, scale removal, water shutoff, recompletion, stimulation, or facility debottlenecking. Each option has different costs, risks, and uncertainty.
For example, removing a confirmed scale restriction may restore production quickly, while stimulating a water-producing interval could increase disposal burden without improving oil recovery. State the suspected mechanism, supporting evidence, expected benefit, operational risk, and how success will be measured before acting.
🦺 Keep Safety and Integrity in the Decision
Production optimization must not bypass well-control, pressure-control, chemical-handling, electrical, or mechanical-integrity requirements. An apparently simple adjustment can expose personnel to pressure, hydrocarbons, produced water, rotating equipment, or hazardous chemicals.
Corrosion trends, annular pressure behavior, leaks, and sand production may also signal integrity concerns that deserve attention even when the production loss appears modest. A higher rate is not a successful outcome if it compromises safe containment.
🤝 Create a Routine Surveillance Conversation
Early detection improves when operators, production engineers, facility personnel, and reservoir engineers share observations. Operators may notice cycling, noise, leaks, changing tank behavior, or equipment run-time changes before those clues appear in a formal report.
A practical review asks: What changed? When did it change? Was there a corresponding operational event? Do rates, pressures, fluids, and equipment indicators tell the same story? This creates a repeatable path from observation to action.
✅ The Core Principle: Diagnose the System, Not the Number
Early production decline is best identified by comparing reliable trends under comparable conditions and then tracing the change through the full production system. Rate, water cut, GOR, pressures, uptime, artificial-lift behavior, and surface constraints each describe only part of the well’s condition.
The most valuable early warning is not a low production number; it is a consistent pattern that reveals why the number changed. Confirm the data, classify the pattern, test the most plausible causes, and select the least risky action that can be measured afterward.
With disciplined surveillance, declining production becomes a question that can be investigated rather than a surprise that is discovered after valuable operating time has already been lost. 🛢️📈🔧