
A well is producing 420 barrels of oil per day. The latest flowing bottomhole pressure is 2,350 psi, and the reservoir pressure estimate is 3,250 psi. Is the well performing well, poorly, or exactly as expected?
Production rate alone cannot answer that question. A high-rate well may simply have a large pressure drawdown, while a lower-rate well may be remarkably efficient at moving fluids through the reservoir and completion.
The productivity index, usually shortened to PI, turns those two measurements into a practical performance indicator. It connects how much a well produces with the pressure difference that causes flow.
For students, PI makes inflow performance tangible. For production engineers, it is a fast diagnostic tool—but only when the pressure and rate data represent the same physical conditions.
🧭 What Productivity Index Means
Productivity index is the production rate delivered by a well per unit of pressure drawdown. For an oil well operating above bubble point under approximately steady conditions, it is commonly written as J or PI.
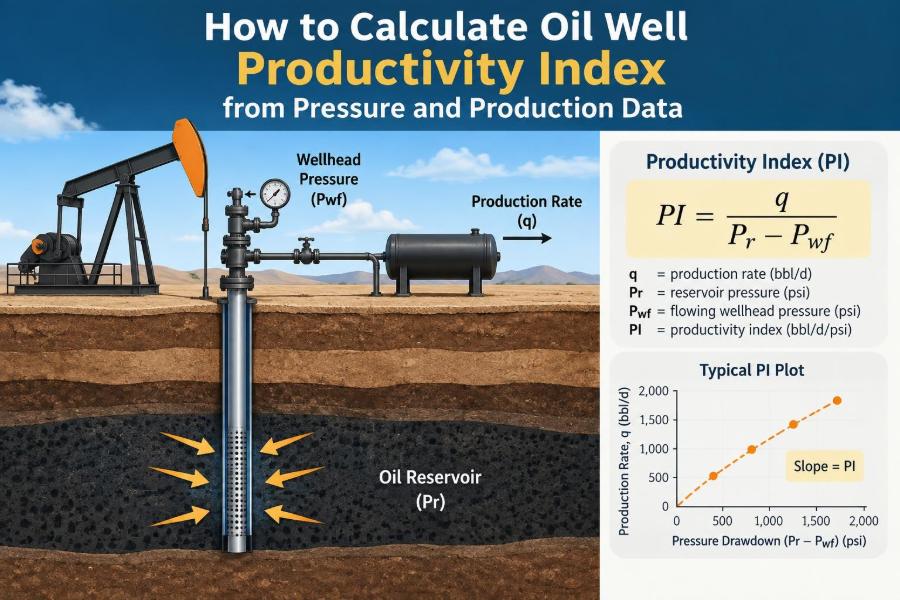
J = q / (p̄r − pwf)Here, q is the stabilized liquid or oil production rate, p̄r is average reservoir pressure, and pwf is flowing bottomhole pressure. If rate is in barrels per day and pressure is in psi, PI has units of bbl/d/psi.
🔩 The Physical Picture Behind the Equation
Pressure is the driving force that pushes reservoir fluids toward the wellbore. The reservoir is at a relatively high pressure, while pressure at the sandface during production is lower.
Think of the reservoir as a sponge connected to a straw. A larger pressure difference pulls fluids more strongly, but the sponge permeability, fluid viscosity, and any restriction around the straw determine how easily fluid can move. PI measures the resulting ease of flow for the whole well-reservoir system.
📉 Understanding Pressure Drawdown
Drawdown is the difference between average reservoir pressure and flowing bottomhole pressure:
Δp = p̄r − pwfIf average reservoir pressure is 3,250 psi and flowing bottomhole pressure is 2,350 psi, the drawdown is 900 psi. A positive drawdown is expected for a producing well.
Drawdown must be interpreted carefully. More drawdown can increase rate, but it can also increase gas liberation, water or gas coning risk, fines movement, and stress on artificial-lift equipment.
🧮 The Basic PI Calculation
Suppose a hypothetical oil well produces 420 STB/d at stabilized conditions. Its average reservoir pressure is 3,250 psi and its flowing bottomhole pressure is 2,350 psi.
J = 420 / (3,250 − 2,350)
J = 420 / 900
J = 0.467 STB/d/psi
This result means that, near these conditions, the well delivers about 0.467 stock-tank barrels per day for each psi of drawdown. It does not mean every extra psi will always add exactly that rate; that linear interpretation has limits.
📏 Use Consistent Rate Definitions
Before calculating PI, decide what rate represents the well’s inflow. In many oil-well applications, engineers use stabilized oil rate or total liquid rate, depending on the operating objective and the convention used in the field.
Do not silently combine an oil rate with a PI that colleagues interpret as liquid PI. Water production can become substantial over a well’s life, so an oil PI and liquid PI may tell different stories.
- Oil PI: oil rate divided by drawdown.
- Liquid PI: oil plus water rate divided by drawdown.
- Gas-well deliverability: usually requires a different framework because gas compressibility makes the relationship nonlinear.
🛢️ Stock-Tank and Reservoir Volumes Are Not Interchangeable
Production rates are often reported as stock-tank barrels per day, while fluid movement in the reservoir occurs at reservoir conditions. Formation volume factor converts between these volume bases.
A simple field PI calculation often uses the reported surface rate consistently and is still useful for comparison. But reservoir-engineering models may require rate at reservoir conditions, especially when coupling inflow calculations to material balance or simulation.
The key is to state the basis. A number without its rate basis, pressure reference, and measurement conditions is difficult to compare reliably.
🎯 Why Flowing Bottomhole Pressure Matters
Flowing bottomhole pressure is the pressure near the producing formation while the well is flowing. It is not the same as wellhead pressure, tubing-head pressure, or separator pressure.
Surface pressure is easier to obtain, but the pressure loss through tubing, flowline, chokes, and multiphase flow can be large. Using wellhead pressure directly in the PI equation generally produces a misleading drawdown unless a validated pressure-gradient calculation converts it to bottomhole conditions.
🧪 How Bottomhole Pressure Is Measured
The most direct approach is a downhole gauge placed at, or corrected to, the perforated interval. Permanent gauges can provide frequent data, while memory gauges are commonly deployed during a survey.
When no downhole gauge is available, flowing bottomhole pressure may be estimated from surface pressure, fluid properties, well geometry, temperature, and a multiphase flow correlation. This estimate can be useful, but its uncertainty should be recognized rather than hidden behind extra decimal places.
🏞️ Average Reservoir Pressure Is a Different Measurement
Average reservoir pressure represents the pressure of the drainage area supplying the well. It is usually estimated from pressure-transient analysis, shut-in pressure data, buildup surveys, material balance, reservoir simulation, or carefully interpreted surveillance data.
It is not normally safe to substitute a single static pressure recorded near the wellbore after a short shut-in. That pressure may still be affected by prior production and may not represent the average pressure of the connected reservoir volume.
⏱️ Stabilized Conditions Make PI More Meaningful
The basic PI equation assumes that rate and pressure describe the same flow condition. A rate measured during a rapid choke change and a pressure measured before the well stabilizes do not form a dependable pair.
For practical surveillance, use a period where the well has operated at a reasonably steady rate, with stable artificial-lift settings and no recent major interruptions. “Stable” is operationally relative, but the aim is to avoid treating transient behavior as a reservoir property.
🗂️ A Minimum Data Checklist
A defensible PI calculation begins with more than three numbers. Capture the context that allows another engineer to judge whether the result is comparable with prior values.
- Date and time of the rate and pressure observations.
- Oil, water, gas, and total-liquid rates with units.
- Flowing bottomhole pressure, gauge depth, and pressure datum.
- Average reservoir pressure estimate and its source.
- Choke size, pump speed, gas-lift conditions, or other lift settings.
- Recent workovers, stimulations, shut-ins, and operating changes.
🧾 A Repeatable Calculation Workflow
- Confirm that the well was producing under near-stable conditions.
- Select the rate basis: oil rate or total liquid rate.
- Obtain or estimate flowing bottomhole pressure at the appropriate depth.
- Obtain an average reservoir pressure estimate on a compatible datum.
- Calculate drawdown by subtracting flowing pressure from reservoir pressure.
- Divide rate by drawdown and report units.
- Record assumptions, data quality, and the operating conditions.
This workflow is simple, but the validation steps often matter more than the arithmetic.
🧷 Keep Pressure Datums Consistent
Pressures must refer to the same vertical datum before subtraction. Reservoir pressure may be reported at a reference depth, while a downhole gauge reads at a different measured or true vertical depth.
Correcting pressure between depths requires an appropriate fluid gradient and an understanding of the well’s deviation. A mismatch of only a few hundred feet can create enough pressure error to distort PI, particularly in low-drawdown wells.
📊 Interpreting a High or Low PI
A higher PI means more rate for the same drawdown, but it is not automatically “good” in every context. It may reflect high permeability, a long completed interval, hydraulic-fracture conductivity, low-viscosity fluid, or strong pressure support.
A lower PI can reflect tighter rock, thicker or more viscous oil, partial penetration, damaged perforations, scale, skin, multiphase effects, or a lower effective drainage area. Comparison is most useful among wells with similar geology, completion design, fluid system, and measurement method.
| Observed change | Possible interpretation | Useful follow-up |
|---|---|---|
| PI falls while drawdown rises | Damage, changing flow regime, or inaccurate pressure estimate | Review well events and pressure data |
| PI rises after treatment | Reduced skin or improved connection to reservoir | Confirm sustained response |
| PI stable while rate declines | Reservoir pressure depletion may dominate | Update reservoir pressure estimate |
| PI changes abruptly overnight | Operating or measurement change may be responsible | Check gauges, choke, lift, and allocation |
📈 The Linear Inflow Assumption
The equation q = J(p̄r − pwf) describes a straight-line inflow performance relationship, or IPR. It is a reasonable approximation for undersaturated oil flow when flowing bottomhole pressure remains above bubble point and fluid properties do not change dramatically.
On a plot of rate versus flowing bottomhole pressure, the line slopes downward. Extrapolating that line to zero flowing pressure gives an idealized maximum rate, but it should not be treated as an attainable operating target.
🫧 What Changes Below Bubble Point
When flowing bottomhole pressure falls below bubble point, gas can evolve from the oil near the wellbore. Relative permeability changes, gas and oil compete for flow paths, and oil mobility can decline.
Under these conditions, inflow is commonly nonlinear. A single constant PI can still serve as a rough surveillance indicator, but it may overpredict oil rate at deeper drawdowns. Use a multiphase IPR method suited to the fluid system rather than assuming a straight line remains valid.
📐 Vogel IPR and Its Place
For solution-gas-drive oil wells, the Vogel relationship is widely used as an empirical approximation to nonlinear inflow behavior. In normalized form, it relates rate to the ratio of flowing bottomhole pressure to average reservoir pressure.
q / qmax = 1 − 0.2(pwf/p̄r) − 0.8(pwf/p̄r)²Vogel is valuable for estimating an IPR curve when gas evolves near the wellbore. It is not a substitute for understanding the reservoir, and its assumptions should be checked before using it for critical operating decisions.
🧱 Skin Can Depress Productivity
Skin describes additional pressure loss near the wellbore relative to an ideal completion. Positive skin indicates extra resistance; negative skin often indicates improved flow capacity, such as after successful stimulation.
Formation damage from drilling or completion fluids, scale deposition, fines migration, perforation restrictions, and inadequate cleanup can all increase skin. Because this resistance occurs close to the well, it can reduce PI even when the broader reservoir has good permeability.
💥 Stimulation and PI Improvement
Acidizing, reperforating, cleaning, and hydraulic fracturing may improve productivity by reducing near-wellbore restrictions or creating more conductive flow paths. A before-and-after PI comparison is a useful first check of response.
However, compare equivalent conditions. A higher post-treatment rate could result from a larger drawdown, a changed pump setting, different fluid cut, or an updated reservoir-pressure estimate rather than a lasting inflow improvement.
🚰 Water Cut Changes the Operating Story
As water cut rises, total liquid PI may remain stable or increase while oil PI declines. This is not necessarily contradictory: the well may still move liquids efficiently, but an increasing share of that liquid is water.
For production decisions, track oil rate, water rate, water cut, total liquid rate, and both oil and liquid productivity indicators where useful. Looking at only one metric can obscure whether a well’s economic performance is improving or deteriorating.
🌬️ Gas Interference and Multiphase Flow
Free gas near the wellbore can reduce oil relative permeability and alter pressure behavior. In the tubing, gas may lower hydrostatic pressure but can also create unstable flow, heading, and changes in the relationship between surface pressure and bottomhole pressure.
This is why a calculated PI should be interpreted alongside gas-oil ratio, flowing pressure trends, and artificial-lift performance. A changing PI can be a reservoir signal, a completion signal, or a wellbore-flow signal.
⚙️ Couple PI With Artificial Lift
PI describes inflow from reservoir to wellbore. Artificial lift governs how the produced fluid is lifted from the wellbore to surface. These are connected but distinct parts of the production system.
A larger pump, lower gas-lift operating pressure, or changed choke may reduce flowing bottomhole pressure and increase rate. The apparent production gain does not necessarily mean PI improved; the well may simply be operating at a different point on the same IPR curve.
🔄 Nodal Analysis Connects Inflow and Outflow
Nodal analysis combines the inflow performance relationship with the vertical-lift performance relationship, or VLP. The IPR shows what the reservoir can deliver at each bottomhole pressure; the VLP shows the pressure required to lift each rate to surface.
The intersection is the operating point. PI is therefore a key input to optimization, but it cannot independently predict the final production rate without accounting for tubing, lift method, separator pressure, and surface constraints.
🧠 Example With Two Operating Points
Consider a hypothetical well with average reservoir pressure of 3,000 psi. During one stable test, it produces 300 STB/d at a flowing bottomhole pressure of 2,400 psi.
J = 300 / (3,000 − 2,400) = 0.50 STB/d/psiAfter a pump adjustment, it produces 400 STB/d at 2,200 psi. The calculated PI is 400 / 800 = 0.50 STB/d/psi. Rate increased, but inflow productivity stayed the same; the operating drawdown increased.
🧮 Spreadsheet Formula and Unit Discipline
In a spreadsheet, the formula can be as simple as =Rate/(ReservoirPressure-FlowingBHP). Add error flags for nonpositive drawdown, missing values, and suspiciously low or high pressures.
Use one unit system within a calculation. A common error is mixing kPa and psi, or entering a rate in m³/d while interpreting the result as bbl/d/psi. Label every input column and calculated output explicitly.
🚩 Common Calculation Mistakes
- Using tubing-head pressure as though it were flowing bottomhole pressure.
- Combining rate and pressure data from different operating periods.
- Subtracting pressures reported at different depth datums.
- Using a stale reservoir-pressure estimate after significant depletion.
- Applying a linear PI below bubble point without qualification.
- Comparing oil PI from one well with liquid PI from another.
- Reporting many decimal places despite uncertain pressure inputs.
Most PI errors are not algebra errors. They are definition, measurement, datum, or operating-context errors.
🔍 Investigating a Falling PI Trend
A gradual PI decline may be consistent with increasing skin, scale accumulation, changing relative permeability, compaction effects, or a shrinking effective flow area. It can also emerge from a deteriorating pressure estimate or a change in how bottomhole pressure is calculated.
Start with a timeline: production rates, water cut, gas-oil ratio, pressure surveys, chemical treatments, workovers, lift changes, and gauge changes. Then determine whether the decline appears in repeatable, comparable operating conditions.
🧰 Improving Data Quality in the Field
Routine surveillance is more useful when the method is repeatable. Define a standard test duration, record the pressure source, preserve gauge calibration records, and document lift settings with each test.
Where feasible, periodically validate calculated flowing bottomhole pressure with downhole measurements. The goal is not to eliminate all uncertainty; it is to know which uncertainty is large enough to alter a decision.
📅 Use PI as a Trend, Not a Lone Number
A single PI value is a snapshot. A sequence of comparable values can reveal whether a well is stable, gradually losing inflow capacity, or responding to an intervention.
Trend PI beside drawdown, reservoir pressure, oil rate, liquid rate, water cut, gas-oil ratio, and operating configuration. This wider view prevents an isolated number from being mistaken for a complete diagnosis.
⚖️ Limits of Productivity Index
PI does not directly measure reserves, permeability, ultimate recovery, economics, or mechanical well integrity. It is influenced by all of these indirectly through flow behavior, but it cannot replace pressure-transient analysis, production logging, well testing, or integrated production-system modeling.
It is also sensitive to uncertainty when drawdown is small. If reservoir and flowing pressures are close, a modest pressure error can cause a large relative error in calculated PI.
✅ A Practical Reporting Template
A concise production note might read: “Liquid PI calculated as 1.2 bbl/d/psi using 960 bbl/d total liquid rate, average reservoir pressure of 2,850 psi, and stabilized flowing bottomhole pressure of 2,050 psi. Pressures referenced to the perforation midpoint. Bottomhole pressure estimated from calibrated tubing model.”
That statement communicates the value, calculation basis, conditions, and a major limitation. It is far more useful than reporting “PI = 1.2” alone.
🏁 The Core Principle to Remember
Productivity index is fundamentally a ratio of delivered rate to pressure drawdown. The calculation is easy: determine a representative rate, subtract flowing bottomhole pressure from average reservoir pressure, and divide.
The engineering judgment lies in making sure the pressures share a datum, the data represent the same stable condition, the rate basis is clear, and the chosen inflow model matches the fluid behavior. Above bubble point, PI can be a powerful linear approximation; below bubble point or in complex multiphase flow, it becomes a more limited indicator that needs support from an appropriate IPR model.
A trustworthy PI is not just a quotient—it is a well-documented description of how efficiently a specific well converts reservoir pressure drawdown into production. 🛢️📈🔧