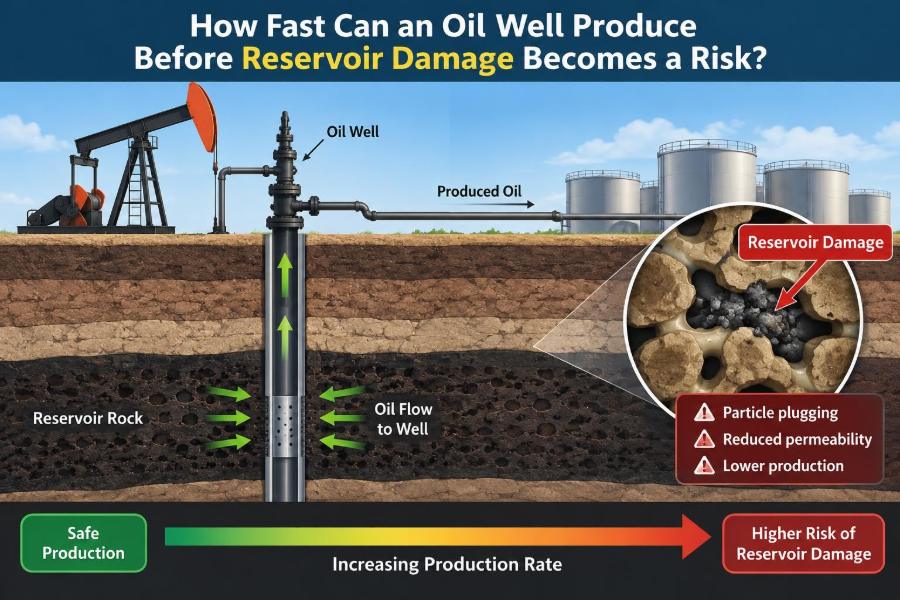

A well comes online, surface equipment is ready, and the early production figures look promising. The natural instinct is understandable: open the choke, capture as much oil as possible, and recover the investment sooner.
But a reservoir is not a storage tank with a wide-open valve. It is a connected system of rock pores, fluids, pressure, and flow paths. Pulling fluids out too aggressively can change that system in ways that reduce future production, increase water or sand handling, and sometimes leave recoverable oil harder to reach.
That does not mean every well should produce slowly. Some reservoirs tolerate high rates well, while others are highly sensitive to pressure drawdown, gas release, fine-particle movement, or weak formation rock.
The practical question is not simply, “What is the highest rate today?” It is, “What rate creates the best technical and economic outcome over the life of this well?”
🧭 There Is No Universal Safe Production Rate
No single barrels-per-day figure defines a safe oil production rate. A rate that is routine in a thick, high-permeability sandstone may damage a low-permeability carbonate or an unconsolidated sand reservoir.
The limiting rate depends on reservoir pressure, permeability, fluid properties, rock strength, well geometry, completion design, nearby wells, and facilities constraints. A producing rate is therefore an operating decision based on evidence, not a number copied from another field.
The maximum sustainable rate is usually more valuable than the maximum instantaneous rate. The latter may create an impressive test result while shortening the well’s productive life.
🪨 Start With the Reservoir–Well System
Hydrocarbons occupy tiny connected pore spaces in reservoir rock. To reach the wellbore, oil must flow through those pores, into perforations or an open-hole interval, and then up the well.
Every part of that path offers resistance. The reservoir supplies fluid; the completion admits it; the wellbore lifts it; and surface facilities separate, measure, and handle it. A constraint in any one part can limit the sensible operating rate.
This is why “the well can flow at that rate” does not necessarily mean “the reservoir should be produced at that rate.” A strong wellbore or large tubing cannot compensate for a reservoir that responds poorly to high drawdown.
📉 Drawdown Is the Central Control Variable
Drawdown is the difference between average reservoir pressure and flowing pressure near the wellbore. It is the pressure force that moves fluid toward the well.
Increasing drawdown usually increases production rate, at least initially. Lowering bottomhole flowing pressure by opening the choke, reducing backpressure, or increasing artificial lift gives the reservoir a stronger push toward the well.
The trade-off is that excessive drawdown concentrates stress and flow near the wellbore. That local disturbance can trigger problems long before the average reservoir pressure appears alarming.
🧪 Productivity Index Connects Pressure to Rate
A simple way to describe well performance is the productivity index, often written as the production rate divided by pressure drawdown. A high productivity index means the well delivers substantial flow for a given pressure difference.
For a simplified single-phase situation, engineers may use the relationship q = J(pr − pwf), where q is rate, J is productivity index, pr is reservoir pressure, and pwf is flowing bottomhole pressure.
Real wells are more complicated. Oil, gas, and water may flow together; pressure changes across the reservoir; and productivity can decline as conditions change. Still, the concept is useful: a larger rate generally requires either better productivity or more drawdown.
🕳️ The Pressure Funnel Around a Producing Well
Production creates a pressure depression around the well, often called a pressure funnel or cone of depression. Pressure is lowest near the wellbore and gradually rises farther into the reservoir.
At modest rates, that funnel may be broad and manageable. At high rates, the pressure gradient close to the well becomes steep, making near-well effects disproportionately important.
Think of drinking through a straw. Gentle suction moves liquid steadily. Pull too hard in a drink containing ice, foam, or sediment, and the flow can become unstable or draw unwanted material toward the straw. Reservoir flow has different physics, but the operating intuition is similar.
🛢️ Oil Rate Is Only Part of the Production Story
An oil well rarely produces oil alone. It may produce dissolved gas that comes out of solution, free gas entering from the reservoir, formation water, entrained solids, or chemicals injected for flow assurance.
A rising liquid rate may conceal an unfavorable shift in composition. For example, a high-rate setting can accelerate water influx or cause gas to dominate the flow stream, reducing oil efficiency and challenging separators, compressors, and pumps.
Operators therefore watch oil rate alongside gas-oil ratio, water cut, flowing pressure, sand production, fluid levels, and other indicators. A healthy production strategy considers the whole stream.
🫧 Producing Below Bubble Point Can Change Flow Behavior
Bubble-point pressure is the pressure at which gas first begins to come out of solution in an oil system at reservoir temperature. Above it, the oil is undersaturated; below it, free gas can appear.
Free gas is not automatically harmful. Gas can contribute energy and may be managed effectively in some reservoirs. The problem arises when high drawdown causes gas to evolve near the wellbore and occupy pore space that oil would otherwise use for flow.
This can reduce oil relative permeability, meaning oil has less effective ability to move through rock in the presence of gas. A well may then show increasing gas production without a proportional gain in oil rate.
🌪️ Gas Coning Can Arrive Early at High Rates
Where a gas cap overlies an oil zone, aggressive production can pull gas downward toward the perforations. This localized movement is known as gas coning.
Once gas reaches the well, the well may produce excessive gas while bypassing oil in other parts of the reservoir. The resulting pressure losses and handling requirements can limit oil production.
Coning risk depends on vertical distance from the gas-oil contact, reservoir anisotropy, permeability distribution, completion placement, and rate. It is not controlled by rate alone, but rate is one of the few variables operators can adjust quickly.
💧 Water Coning and Water Cresting Follow Similar Logic
A water zone beneath an oil interval can move upward toward a producing completion when drawdown is high. This is called water coning; in more laterally extensive movement, engineers may refer to water cresting or encroachment.
Water production consumes handling capacity, raises lifting and disposal costs, and may reduce oil relative permeability near the well. In some cases, reducing the rate early can delay water breakthrough and improve total oil recovery from that well.
However, cutting rate after water has already established a strong path may not fully reverse the problem. Prevention through completion placement, surveillance, and controlled drawdown is often more effective than reacting late.
🏖️ Sand Production Is a Rock-Strength Problem
Some formations are sufficiently weak that pressure depletion and high fluid velocity can dislodge grains from the rock framework. Those grains may enter the well as produced sand.
Small, manageable amounts of solids are not always catastrophic, but uncontrolled sand production can erode chokes and valves, fill the wellbore, damage pumps, block perforations, and threaten completion integrity. Severe sanding can also create cavities and destabilize the formation.
The relevant limit is often called a critical drawdown: the pressure differential beyond which formation failure or unacceptable sand influx becomes likely. It must be estimated from geomechanical data, logs, cores when available, and field response.
🔬 Fines Migration Can Damage Permeability Quietly
Not all damaging particles are visible as produced sand. Tiny clay or mineral particles, called fines, can detach and move through pore throats when fluid velocity, salinity, pH, or stress conditions change.
Those particles may lodge in smaller pore passages near the wellbore and reduce permeability. The result can be a gradual loss of productivity that looks like normal decline but is actually near-wellbore damage.
Rate changes should therefore be considered alongside fluid compatibility. A rapid drawdown increase after workover fluids, water injection changes, or chemical treatment deserves particular care because multiple damage mechanisms may act together.
🧱 Compaction and Subsidence Are Field-Scale Concerns
As reservoir pressure falls, the effective stress carried by the rock framework rises. In compactable reservoirs, pore volume can decrease and the rock may deform.
Some compaction can help expel fluids and provide drive energy. Excessive or uneven compaction, however, can reduce permeability, damage wells and completions, or contribute to surface subsidence in susceptible settings.
This risk is usually evaluated at reservoir or field scale rather than from a single well rate alone. Still, rapid depletion from high-rate wells can make pressure management more difficult, especially where pressure support is limited.
🧯 Near-Wellbore Damage Is Often the First Penalty
The first harm from an aggressive rate is frequently concentrated near the wellbore, where pressure gradients and velocities are greatest. Scale deposition, organic deposits, fines plugging, phase changes, and mechanical damage can all create a low-permeability zone.
This effect is commonly expressed as skin. Positive skin means additional flow resistance near the wellbore; negative skin can indicate stimulation or improved flow access.
A declining rate does not automatically prove reservoir depletion. Before assuming the reservoir is weak, engineers ask whether the well has accumulated skin that could be diagnosed and possibly treated.
🧰 Completion Design Sets a Practical Operating Window
Perforation density, perforation orientation, tubing size, gravel-pack design, screens, inflow-control devices, and open-hole configuration all influence how a well handles rate.
A completion that spreads inflow across a longer interval can reduce local velocity and drawdown compared with one that concentrates flow through a short interval. In a heterogeneous reservoir, however, opening more interval may also expose a high-water or high-gas zone.
Completion design is therefore not simply about maximizing connectivity. It is about creating controlled connectivity to the most valuable parts of the reservoir.
🧭 Horizontal Wells Change the Rate Conversation
A horizontal well contacts much more reservoir than a vertical well. That larger contact area can deliver a given total rate with lower local inflow velocity and lower drawdown per unit length.
For that reason, horizontal wells can sometimes produce economically at rates that would be unrealistic for a nearby vertical well. But they introduce their own risks, including uneven inflow, heel-toe pressure effects, and early water or gas entry from one segment.
Inflow-control devices and compartmentalized completions may help distribute production. Their value depends on reservoir architecture and the ability to monitor where unwanted fluids are entering.
⚖️ Rate Limits Have Several Different Meanings
People often say a well has a “maximum rate,” but the constraint may come from very different places. Separating them prevents poor decisions.
| Rate limit | What sets it | What can happen if exceeded |
|---|---|---|
| Reservoir limit | Drawdown, coning, depletion, rock response | Lower recovery, gas or water breakthrough, formation damage |
| Completion limit | Sand control, screens, perforations, tubular capacity | Erosion, sanding, equipment damage, integrity problems |
| Wellbore lift limit | Flow regime, pump capacity, tubing pressure loss | Unstable flow, liquid loading, pump inefficiency |
| Facility limit | Separator, compressor, water treatment, export capacity | Off-spec fluids, flaring constraints, curtailment |
| Economic limit | Revenue, energy use, intervention cost, decline behavior | Value destruction despite high initial output |
A prudent operating rate must satisfy all applicable limits, not just the one that is easiest to observe at the surface.
📈 Initial Production Rate Can Be Misleading
A high initial production rate is often celebrated because it improves early cash flow and demonstrates deliverability. Yet it is only one point on a much longer production history.
Consider a hypothetical well in an oil zone above water. At a very aggressive choke setting, it may initially deliver more oil, but the stronger drawdown can pull water upward sooner. At a moderated setting, early oil volume is lower, but the well may maintain a more favorable water cut for longer.
The better option cannot be chosen from the first few days of data alone. It requires forecasting, uncertainty analysis, and a clear definition of value: cumulative oil, net present value, recovery factor, equipment reliability, or a combination of these.
🧮 Inflow Performance Helps Define Deliverability
An inflow performance relationship, or IPR, describes how reservoir inflow changes with flowing bottomhole pressure. It is a core tool for estimating what the reservoir can deliver under different drawdowns.
For undersaturated oil, a simple linear approximation may sometimes be useful. For solution-gas-drive conditions, the relationship is often curved because multiphase flow changes as pressure falls.
IPR is not a permanent label. It should be updated as pressure declines, water cut changes, stimulation occurs, or well damage develops. Using an old IPR to justify a new aggressive rate can be misleading.
🚰 Outflow Performance Can Be the Real Bottleneck
Even if the reservoir can deliver more fluid, the well may not lift it efficiently. Tubing friction, hydrostatic pressure, gas-liquid flow behavior, choke restrictions, and separator pressure all shape the outflow requirement.
Engineers combine inflow and outflow curves in nodal analysis. Their intersection estimates an operating point where the reservoir can supply what the wellbore and surface system can carry.
Improving outflow—by changing tubing, reducing backpressure, or optimizing artificial lift—can raise production without demanding the same additional reservoir drawdown. That distinction can protect the reservoir while improving rate.
🧾 Well Tests Reveal More Than a Production Number
Pressure transient testing, such as drawdown and buildup testing, examines how pressure changes when a well rate changes or shuts in. The pressure response can indicate permeability, skin, boundaries, and sometimes communication with other parts of the reservoir.
Tests are interpreted with assumptions and may be complicated by multiphase flow, changing rates, and heterogeneous geology. They are not crystal balls, but they provide information that daily rate data cannot.
Flowback after a stimulation, cleanup after a workover, and a controlled rate test should also be interpreted carefully. A short-term rate may reflect cleanup conditions rather than stable reservoir performance.
📡 Surveillance Turns Rate Control Into Feedback Control
Good rate management is iterative. Operators set a rate, observe the response, compare it with expectations, and adjust when evidence indicates a different operating window.
Useful surveillance may include flowing and static pressure measurements, well tests, fluid samples, production allocation, water and gas trends, sand monitoring, pump diagnostics, and downhole gauges where installed.
Trend quality matters. A single noisy measurement should not trigger a major choke change, but a persistent rise in gas-oil ratio, water cut, or sand rate after a rate increase deserves investigation.
🪜 Choke Management Should Be Deliberate
A choke restricts flow and helps control wellhead pressure and rate. Changing choke size can be a simple operational action with significant reservoir consequences.
A staged approach is commonly more informative than a large, sudden opening. Increase rate in planned increments, allow conditions to stabilize where practical, and track pressure, oil, gas, water, and solids response.
- Define the purpose of the change: cleanup, deliverability test, facility optimization, or sustained target rate.
- Set measurable stop criteria, such as unacceptable sand, rapid water increase, unstable flow, or pressure behavior outside expectations.
- Confirm that separators, gas handling, water treatment, and safety systems can manage the new stream.
- Record choke position and operating conditions accurately so later analysis is meaningful.
Fast changes are sometimes necessary for safety or operational reasons. They should not become the default substitute for understanding the reservoir.
🤖 Artificial Lift Can Increase Rate Without Solving Reservoir Limits
Rod pumps, electric submersible pumps, gas lift, progressive cavity pumps, and other artificial-lift systems reduce flowing bottomhole pressure or help lift fluids to surface. They can restore or increase production when natural energy is insufficient.
But stronger lift can also deepen drawdown. If the reservoir is prone to gas coning, water coning, sanding, or near-wellbore damage, simply installing a larger pump may transfer the constraint from the wellbore to the reservoir.
Artificial lift selection should be integrated with reservoir management. The goal is not maximum pump capacity; it is stable, efficient production at an appropriate drawdown.
🌊 Pressure Support Changes the Sustainable Rate
Water injection, gas injection, and natural aquifer support can help maintain reservoir pressure and displace oil toward producers. With effective pressure support, a field may sustain stronger production with less drawdown than under depletion alone.
Support is not automatically uniform. Injected water follows the reservoir’s permeability pathways, which may bypass oil or reach a producer early. Poor injector-producer balance can accelerate water breakthrough rather than improve sweep.
Production and injection rates should therefore be managed together. A producer’s safe rate may depend partly on whether nearby injectors are supplying pressure and how fluids are moving between wells.
🧩 Reservoir Heterogeneity Defeats Simple Rules
Real reservoirs contain layers, fractures, barriers, channels, and permeability variations. A well may be connected to several flow units that respond very differently to the same drawdown.
A high-permeability streak can dominate early production and bring water or gas prematurely, while tighter intervals containing substantial oil contribute little. Reducing total rate may help, but selective completion changes, zonal isolation, or inflow control can sometimes address the source more directly.
This is why average reservoir properties can be dangerous when used alone. The well experiences local geology, not the field-average map.
🛠️ When a Rate Cut Is Not the Best Remedy
Reducing rate is often a sensible first response to excessive drawdown, but it is not a cure for every production problem. If the root cause is scale, wax, a failing pump, blocked perforations, or facility backpressure, a rate cut may merely postpone action.
Likewise, water production caused by a completed water-bearing interval may require a mechanical or chemical water-control strategy rather than broad production curtailment. Each option carries uncertainty and must be matched to the diagnosed flow path.
The disciplined sequence is diagnose, model, intervene where justified, and then verify performance. Treating every decline as a reservoir-rate issue wastes opportunities and can introduce unnecessary losses.
⚠️ Common High-Rate Operating Mistakes
Many damaging decisions start with a narrow focus on daily oil volume. The following patterns deserve scrutiny:
- Chasing a short test peak: treating a cleanup or transient rate as a stable operating target.
- Ignoring fluid ratios: celebrating total liquid growth while water cut or gas-oil ratio deteriorates.
- Using surface pressure alone: assuming wellhead readings fully represent downhole drawdown.
- Overlooking solids: waiting for severe equipment erosion before responding to early sand signals.
- Making large unplanned choke changes: losing the ability to link cause and effect in production data.
- Separating disciplines: optimizing reservoir, artificial lift, and facilities independently when their limits interact.
None of these mistakes is solved by a single formula. They are avoided through shared operating limits, reliable data, and disciplined review.
🧑🏫 A Practical Workflow for Setting a Production Rate
A repeatable workflow helps teams move from a broad target to a defendable operating envelope.
- Establish reservoir pressure, fluid properties, rock and sand-control risks, completion details, and current facility constraints.
- Estimate inflow behavior and outflow requirements using the best available data, while documenting uncertain assumptions.
- Identify possible limiting mechanisms: coning, sanding, gas liberation, compaction, pump limits, or water-handling capacity.
- Choose an initial conservative rate or drawdown range and define monitoring and stop criteria.
- Ramp up in controlled steps where operationally feasible, allowing enough time to distinguish transient cleanup from stable response.
- Update the model with observed pressure and fluid trends, then revise the operating range as evidence improves.
This process is as relevant to a new completion as it is to a mature well being reactivated after an intervention.
📚 What Students Should Remember About “Optimum” Rate
In classroom problems, an optimum rate may appear as the answer to an equation. In field operations, it is usually a range that changes with pressure, water cut, equipment condition, and economic context.
Models simplify reality so engineers can make decisions. Their value lies in making assumptions visible and testing alternatives, not in eliminating uncertainty.
When reviewing a proposed rate, ask three questions: What drawdown does it require? Which damage mechanism is most plausible? What measurements would show that the well is approaching its limit?
🔗 The Core Principle: Produce With Controlled Drawdown
How fast an oil well can produce before reservoir damage becomes a risk depends on the reservoir and the well, not on a universal rate threshold. High productivity, good completion design, pressure support, and robust facilities can widen the operating window; weak rock, nearby contacts, multiphase effects, and heterogeneity can narrow it.
The most reliable approach combines reservoir engineering, production engineering, geomechanics, completion knowledge, and facility operations. It uses models to set expectations and surveillance to challenge them.
Rate is not the goal by itself; controlled drawdown that protects long-term recovery and well integrity is the real operating objective.
A well should produce as fast as the reservoir can support sustainably, not simply as fast as the surface system can pull. That balance protects recoverable value while giving engineers clearer, safer control over the production system. 🛢️📉⚙️