
A reservoir engineer may be asked a question that sounds simple: where is the oil or gas, and how much can the field produce? The difficult part is that the answer lies thousands of metres underground, inside rock that cannot be observed directly except along a few narrow well paths.
Two wells drilled only a short distance apart can encounter very different rock. One may enter clean, connected sandstone that flows readily. The other may find tighter rock, more water, or a sealing shale layer that changes the entire production outlook.
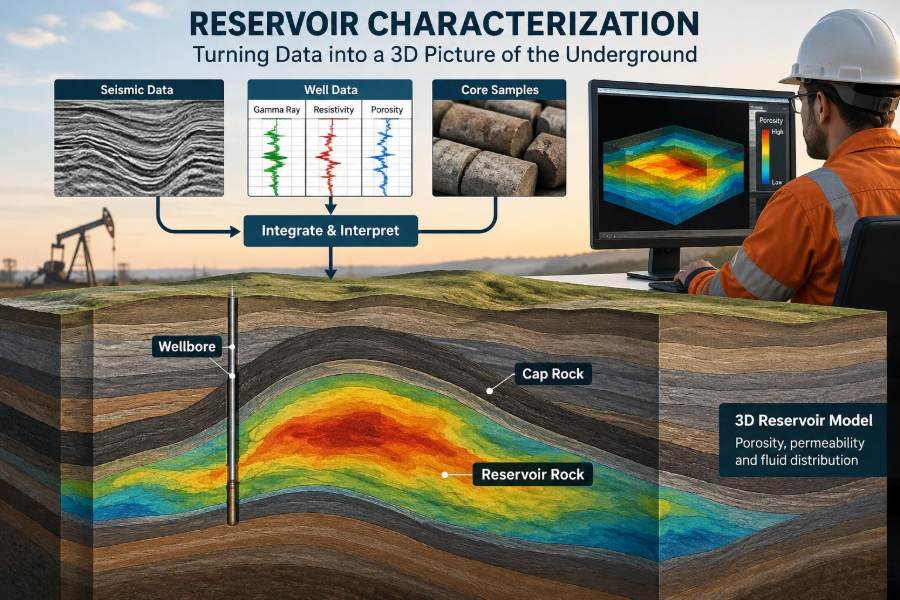
Reservoir characterization is the disciplined process of turning scattered evidence into a working picture of that hidden subsurface system. It combines geology, geophysics, petrophysics, engineering measurements, and production history rather than relying on any one source.
That picture guides decisions with large technical and commercial consequences: where to drill, how to complete a well, whether to inject water or gas, and how confidently to estimate recoverable hydrocarbons. It is never a perfect photograph of the reservoir. It is a tested, continuously improved model of what engineers think is there.
🧭 Reservoir Characterization Starts with a Subsurface Question
Reservoir characterization describes the rock, fluids, and connections that control hydrocarbon storage and flow. The objective is not merely to label a formation; it is to answer decision-focused questions.
For example, an appraisal team may need to know whether a discovery extends beyond one well. A development team may need to identify reservoir compartments and select injector locations. A mature-field team may need to explain why one producer is taking water much earlier than expected.
The required level of detail depends on the decision. A regional exploration assessment can work with broad trends, while a horizontal well placement decision may require metre-scale understanding near the planned well path.
🪨 A Reservoir Is Rock, Pore Space, and Fluid
Hydrocarbons do not normally sit in underground caverns. They occupy tiny connected spaces, called pores, between mineral grains or within fractures in rock.
A useful analogy is a sponge. Its total void space represents porosity, but water can pass through it only if those spaces connect. Reservoir rock works the same way, although its pores are much smaller and its flow paths more complex.
Most conventional reservoirs are sandstones or carbonates. Sandstones commonly contain spaces between deposited grains. Carbonates can include pores created by biological material, dissolution, or fractures, making their internal geometry especially variable.
🔍 The Central Properties Engineers Need to Estimate
Characterization turns observations into estimates of a few linked properties. Each affects the volume of hydrocarbons in place or the ability to produce them.
| Property | What it describes | Why it matters |
|---|---|---|
| Porosity | Fraction of rock volume that is pore space | Controls potential fluid storage |
| Permeability | Ability of connected pores to transmit fluid | Strongly affects flow rate and pressure response |
| Water saturation | Fraction of pore space occupied by water | Helps estimate hydrocarbon-filled pore volume |
| Net pay | Rock interval meeting chosen reservoir and fluid cutoffs | Defines potentially productive thickness |
| Pressure and fluid contacts | Distribution of pressure, oil, gas, and water | Constrain volumes, drive, and compartmentalization |
These quantities are not measured with equal certainty everywhere. Engineers must distinguish between a direct observation, an interpretation, and an interpolation between sparse control points.
🧱 Depositional Environment Creates the First Layer of Variability
Before a reservoir became buried rock, it was sediment deposited in a particular environment. Rivers, deltas, beaches, deep-water channels, dunes, reefs, and shallow marine shelves leave different architectures.
A river channel may deposit a narrow body of relatively coarse sand surrounded by floodplain mudstone. A shoreline system may create broad but layered sand bodies. Those original patterns influence later connectivity between wells.
Geologists therefore ask not only, “Is there sand?” but also, “What kind of sand body is this, how continuous is it, and what fine-grained barriers may interrupt flow?”
🧬 Diagenesis Changes Rock Long After Deposition
Burial, heat, pressure, and reactive fluids alter sediment after it is deposited. This suite of changes is called diagenesis.
Cement minerals can fill pore space and reduce permeability. Grain dissolution can create secondary porosity. In carbonates, dissolution, dolomitization, and fracture development may substantially improve or worsen reservoir quality in irregular patterns.
This is why a clean-looking sand body on a seismic interpretation does not automatically make a good reservoir. The depositional framework must be combined with evidence of post-depositional rock alteration.
🗺️ Structure Defines Traps and Potential Compartments
Structural geology concerns the shape and deformation of rock layers. Folds, faults, tilting, and salt movement can create the geometries that trap hydrocarbons.
A fault may seal flow if clay-rich material is smeared along it or if impermeable rocks are juxtaposed against the reservoir. The same fault may transmit flow elsewhere. Treating every fault as either fully sealing or fully open is usually an oversimplification.
Structural maps are used to identify closure, estimate spill points, and understand whether wells could be in separate pressure compartments. They also influence drilling trajectories and wellbore risk.
🧢 Seal and Trap Keep Hydrocarbons in Place
A reservoir needs more than porous rock. It also needs a trapping configuration and a sufficiently low-permeability seal, often shale, salt, or dense carbonate, to impede upward hydrocarbon migration.
In a structural trap, buoyant hydrocarbons accumulate beneath a sealing layer at a fold or fault closure. In a stratigraphic trap, a reservoir unit may pinch out, change into non-reservoir rock, or be terminated by a depositional boundary.
Characterization examines the reservoir and its surrounding rocks together. A promising porous interval has limited value if the trapping geometry, seal integrity, or fluid distribution is poorly understood.
🌊 Fluid Contacts Are Interpreted, Not Simply Drawn
In an idealized reservoir, gas lies above oil and oil lies above water because of density differences. The boundaries are often described as gas-oil contact and oil-water contact.
Actual transitions can be broad rather than sharp because capillary forces hold water in small pores. Different rock types may also show different saturation behavior at the same elevation.
Pressure measurements, fluid samples, log responses, and production data help establish contacts. An apparent contact in one well should not automatically be projected across a fault or into a different facies without supporting evidence.
⚙️ Capillary Pressure Explains Why Pores Do Not Fill Uniformly
Capillary pressure arises at the interface between two fluids in small pores. It depends on fluid properties, pore throat size, and rock-fluid interaction.
Fine-grained rock with smaller pore throats can retain more water than coarser rock at a comparable height above a free-water level. This means high water saturation does not always mean a zone is nonproductive, but it can reduce relative permeability to hydrocarbons.
Laboratory capillary-pressure measurements and carefully selected analog data help translate elevation into expected saturation trends. Their application should respect rock type and wettability rather than assume one curve fits an entire field.
🧪 Core Provides Direct Physical Evidence
A core is a cylindrical sample of rock recovered while drilling. It is one of the closest available links between a subsurface interpretation and the material itself.
Core examination can reveal grain size, sedimentary structures, fractures, vugs, mud layers, and oil staining. Laboratory analysis can measure porosity, permeability, grain density, capillary behavior, and other properties under controlled conditions.
Core has limitations. It samples a very small volume, recovery may be incomplete, and handling can alter fragile material. Still, when depth-matched and representative, it is essential for calibrating indirect measurements.
📏 Well Logs Turn Boreholes into Continuous Measurements
Wireline and logging-while-drilling tools measure physical responses along the wellbore. Unlike core, logs can provide near-continuous coverage over long intervals.
Common logs include gamma ray for natural radioactivity, density and neutron responses related to lithology and porosity, resistivity related to fluid saturation, and sonic measurements related to rock elastic properties. No single log provides a complete answer on its own.
For instance, low gamma ray often suggests cleaner sandstone, but some non-shale minerals can also produce low readings. Log interpretation works best when checked against core, cuttings, mud logs, and local geological knowledge.
🧮 Petrophysics Converts Log Responses into Reservoir Properties
Petrophysics is the quantitative interpretation of rock and fluid properties from logs, core, and related data. It transforms instrument responses into estimates such as shale volume, porosity, water saturation, and net pay.
Water saturation calculations require assumptions about formation-water resistivity, rock electrical behavior, and lithology. Those assumptions may be uncertain, especially in shaly sands, low-resistivity pay, complex carbonates, or fresh-water environments.
A good petrophysical evaluation shows both the chosen interpretation and its sensitivity to key assumptions. A precise-looking curve should not be mistaken for a certainty level the data cannot support.
📡 Seismic Data Extend Understanding Between Wells
Seismic surveying records reflected sound waves to image subsurface layering and structure over large areas. It provides the lateral context that individual wells cannot.
Seismic can map faults, folds, broad depositional features, and time horizons. With well calibration and suitable data quality, seismic attributes or inversion may also help indicate changes in rock properties.
However, seismic resolution is much coarser than many reservoir layers. A reflector may represent a boundary or a composite response from several thin beds. Engineers must avoid interpreting fine-scale reservoir detail that the seismic data cannot resolve.
🔗 Well Ties Connect Depth, Time, and Geology
Wells are measured in depth, whereas seismic is recorded in two-way travel time. A well tie connects these domains by using sonic and density information to create a synthetic seismic response that can be matched to recorded data.
This step is foundational. If the tie is poor, a mapped seismic horizon may not correspond to the intended geological boundary, shifting depth predictions and structural interpretation.
Velocity variations, poor log quality, and complex geology make tying difficult. Iteration among geophysicists, geologists, and petrophysicists is often more reliable than treating the task as a one-person handoff.
🧱 Facies Explain Why Similar Depths Can Behave Differently
A facies is a body of rock with distinctive characteristics that reflect its depositional setting. Facies may differ in grain size, clay content, pore structure, continuity, and flow behavior.
Imagine two wells at the same structural elevation. One penetrates a channel sand with good connectivity; the other encounters a muddy channel margin. Their porosity and permeability may differ enough to require different completion or development strategies.
Facies models use core descriptions, logs, seismic patterns, and geological concepts to predict these changes between wells. The prediction remains conditional where direct control is sparse.
🧩 Static Models Organize the Geological Picture
A static reservoir model is a three-dimensional representation of structure, faults, stratigraphic layers, facies, porosity, permeability, and fluid properties. It divides the subsurface into grid cells that can hold rock-property estimates.
Model building usually begins with a structural framework, then layers and zones, followed by property population constrained by well data and geological rules. The result supports volumetric calculations and forms the foundation for flow simulation.
A detailed grid is not automatically a better model. Cell size should match data resolution and the decisions required. Excessive detail can create an illusion of knowledge and make simulation unnecessarily expensive.
🎲 Geostatistics Makes Variability Explicit
Geostatistics provides methods for distributing properties between known data points while honoring observed spatial patterns. Variograms, for example, describe how similarity changes with distance and direction.
Deterministic interpolation can produce a single smooth answer. Stochastic simulation creates multiple plausible realizations, each matching well control while representing uncertainty in the unsampled space.
This matters when thin barriers, high-permeability streaks, or channel paths affect flow. One realization may connect two wells; another may not. Evaluating both gives decision-makers a more realistic range of outcomes.
💧 Dynamic Data Test Whether the Geological Story Flows
Static data describe the reservoir’s likely architecture. Dynamic data reveal its response during production or testing. These include pressure measurements, flow rates, water cut, gas-oil ratio, tracer results, and pressure-transient test interpretations.
If pressure communication occurs rapidly between wells, the reservoir may be well connected at the relevant scale. If pressures behave independently, a fault, facies change, or low-permeability zone may be restricting communication.
Dynamic observations do not always point to one unique explanation. A rising water cut might reflect coning near a well, a swept zone, completion placement, fracture behavior, or water moving through a high-permeability pathway.
📈 Reservoir Simulation Tests Development Choices
Dynamic reservoir simulation solves fluid-flow equations through a gridded reservoir model. It is used to investigate depletion, waterflooding, gas injection, pressure maintenance, and well-placement alternatives.
Simulation does not predict the future by itself. It depends on inputs such as relative permeability, pressure-volume-temperature behavior, aquifer support, fault transmissibility, and well operating constraints.
History matching adjusts uncertain model parameters until simulated behavior is reasonably consistent with observed field data. A match to historical rates is useful only if the resulting parameters remain geologically and physically plausible.
🛠️ Rock-Fluid Properties Control Recovery, Not Just Volume
Two reservoirs with similar porosity and hydrocarbon volume can recover very different amounts. Recovery depends on how oil, gas, and water move through the pore network under changing pressure and saturation.
Relative permeability describes the effective ability of each fluid phase to flow when other phases are present. Wettability describes which fluid preferentially contacts the rock surface. Both influence water breakthrough, residual oil, and displacement efficiency.
Special core analysis can measure these behaviors, but data are often limited. Engineers may use analogs and sensitivity cases while clearly tracking where uncertainty in rock-fluid functions could alter forecasts.
🕳️ Fractures Can Transform Flow Behavior
Natural fractures may provide fast flow pathways in otherwise tight rock, particularly in carbonates and some compacted sandstones. They can improve productivity, but they can also accelerate water or gas movement.
Fracture networks are difficult to characterize because their spacing, aperture, connectivity, and orientation vary. Image logs, cores, seismic indicators, drilling observations, and production behavior can provide clues, but rarely a complete map.
Engineers may represent fractures through dual-porosity or dual-permeability simulation approaches when the evidence supports it. Adding a fracture model without data justification can make a model more complex without making it more reliable.
🧭 Scale Mismatch Is a Persistent Challenge
Core plugs may be centimetres long. Logs investigate a larger volume around a borehole. Seismic samples an even broader rock volume, while a production well responds to drainage over a much wider area.
A measurement valid at one scale may not transfer directly to another. A thin shale bed seen in core may be below seismic resolution yet still block vertical flow. Conversely, a seismic feature may summarize heterogeneity that cannot be identified in one core.
Upscaling converts fine-scale properties into values suitable for coarser simulation cells. The method must preserve the flow behavior that matters, particularly directional permeability and vertical barriers.
⚖️ Uncertainty Is an Output, Not an Embarrassment
Every reservoir model contains uncertainty because wells sample only a small fraction of the reservoir and interpretations require assumptions. The goal is not to eliminate uncertainty; it is to identify, quantify where possible, and manage the uncertainties that affect decisions.
Useful uncertainty ranges may concern contact depth, fault sealing, net-to-gross ratio, permeability distribution, aquifer strength, or relative permeability. Their impact differs by decision.
A well location may be robust across many geological realizations. Another may work only if a particular channel is connected. Communicating that distinction is more valuable than presenting one forecast with unjustified confidence.
🚩 Common Mistake: Treating Every Log Value as Ground Truth
Logs are powerful, but they are indirect measurements affected by borehole conditions, tool physics, invasion by drilling fluids, and interpretation assumptions. A clean numerical output does not remove those limitations.
Problems arise when log-derived porosity or saturation is accepted without core calibration, fluid information, or quality control. Depth mismatches between datasets can also create false correlations.
A practical safeguard is to document data quality, environmental corrections, interpretation parameters, and alternative plausible outcomes. This preserves traceability when the model is later updated.
🚧 Common Mistake: Overconfident Fault and Facies Connectivity
Connectivity often has a stronger effect on production than average porosity. Yet it is tempting to draw continuous sands between wells or declare a fault sealing because the map looks tidy.
Instead, engineers should ask what evidence supports connectivity: pressure communication, matching fluid gradients, shared production response, seismic continuity, depositional analogs, or fault-rock analysis. Each evidence type has a different strength and scale.
Where evidence is insufficient, alternative connectivity scenarios should be retained. Drilling, surveillance, and injection plans can then be designed to discriminate among the most decision-relevant cases.
🧫 Common Mistake: Confusing Gross Rock with Net Pay
Gross thickness is the full interval between chosen formation boundaries. Net pay is the part considered capable of economically relevant hydrocarbon production under defined cutoffs.
Cutoffs for shale content, porosity, permeability, and water saturation are not universal constants. They should reflect rock type, completion method, fluid properties, operating conditions, and the field’s technical objectives.
Using arbitrary cutoffs can overstate productive thickness or discard lower-quality rock that may contribute after stimulation. Sensitivity to cutoff choice is often worth testing, especially in heterogeneous reservoirs.
🧰 An Integrated Workflow Reduces Isolated Decisions
Effective characterization is iterative rather than strictly linear. New core data may revise facies interpretation; a revised facies model may change petrophysical zoning; production data may challenge a fault assumption.
- Define the decision and the uncertainty that could change it.
- Quality-control wells, logs, cores, seismic, pressures, and fluid samples.
- Build a structural and stratigraphic framework.
- Interpret rock types, petrophysical properties, contacts, and initial fluids.
- Create alternative static models and calculate volumes.
- Use dynamic data and simulation to test connectivity and development behavior.
- Update the model as drilling and production provide new evidence.
Multidisciplinary review is not bureaucratic overhead. It is where inconsistent assumptions become visible before they influence a costly decision.
🛢️ Well Placement Turns the Model into an Operational Decision
Reservoir characterization directly affects whether a well is vertical, deviated, or horizontal; where it enters the reservoir; and which intervals are perforated or isolated.
In a hypothetical layered oil reservoir, a horizontal well placed too close to the water leg may experience early water production. Placing it higher may delay water arrival, but it could introduce gas-coning risk if a gas cap is nearby. The preferred path depends on fluid contacts, permeability layering, pressure drawdown, and operating strategy.
Geosteering uses real-time logging and geological interpretation to keep a well within a target zone. It is valuable only when the target model and the uncertainty around it are understood well enough to guide adjustments.
📊 Surveillance Keeps the Reservoir Model Alive
Characterization does not end when a field development plan is approved. Pressure surveys, production allocation, water chemistry, repeat logging, tracer tests, and time-lapse seismic can reveal changes that the original model did not anticipate.
Surveillance should be designed around decisions. Measuring pressure in a suspected compartment, for example, can be more useful than collecting a large volume of data with no clear hypothesis.
A living model records what has been learned, what remains uncertain, and why prior assumptions were changed. This makes later interventions more defensible and helps teams avoid repeatedly rediscovering the same issue.
🌱 Characterization Also Supports Responsible Resource Management
A more accurate subsurface model can reduce unnecessary wells, improve sweep efficiency, and help identify unwanted water or gas pathways early. It can also support planning for pressure management, produced-water handling, and well integrity monitoring.
The same core skills apply beyond conventional oil and gas. Geological storage projects, geothermal developments, underground gas storage, and some subsurface hydrogen concepts all require an understanding of porosity, permeability, containment, faults, and pressure behavior.
The application changes, but the central question remains familiar: how will fluids move through this particular rock system under the conditions created by operations?
🎓 Skills That Make a Characterization Engineer Effective
Strong practitioners combine technical depth with the ability to connect disciplines. They can interpret data quality, understand geological context, recognize model limitations, and explain uncertainty in decision-ready language.
Useful habits include keeping assumptions visible, checking depth consistency, comparing independent data sources, and asking what observation would disprove the current interpretation. Basic coding and data visualization can help manage large datasets, but they do not replace physical reasoning.
For students, the best learning path is to connect equations and software outputs back to rock and fluids. Whenever a model changes, ask what physical feature or measurement justifies that change.
✅ The Core Principle: Build a Testable Picture, Not a Perfect One
Reservoir characterization brings together the reservoir’s depositional history, structural setting, pore system, fluid distribution, and production response. Its value lies in making these elements consistent enough to support real decisions.
The strongest models honor available data, respect scale and physics, show uncertainty openly, and remain easy to update when new evidence arrives. A model that looks detailed but cannot explain pressure, fluids, or production is less useful than a simpler model that can be tested.
Ultimately, the underground reservoir is not fully known at the start of a project. Engineers progressively reduce uncertainty by using every well, measurement, and production response as another opportunity to refine the picture.
Reservoir characterization succeeds when it turns incomplete subsurface evidence into a transparent, testable basis for safer and better technical decisions. 🪨📈🛢️