
A well may be drilled thousands of metres below the surface, through rocks that no one will ever see directly. Yet a decision made over a few metres of depth can determine whether a zone is completed, isolated, perforated, or left behind.
That decision depends on measurements. Engineers need to know what rock is present, how much fluid-filled pore space it contains, whether those pores can transmit hydrocarbons, and how conditions are changing while the well is being drilled.
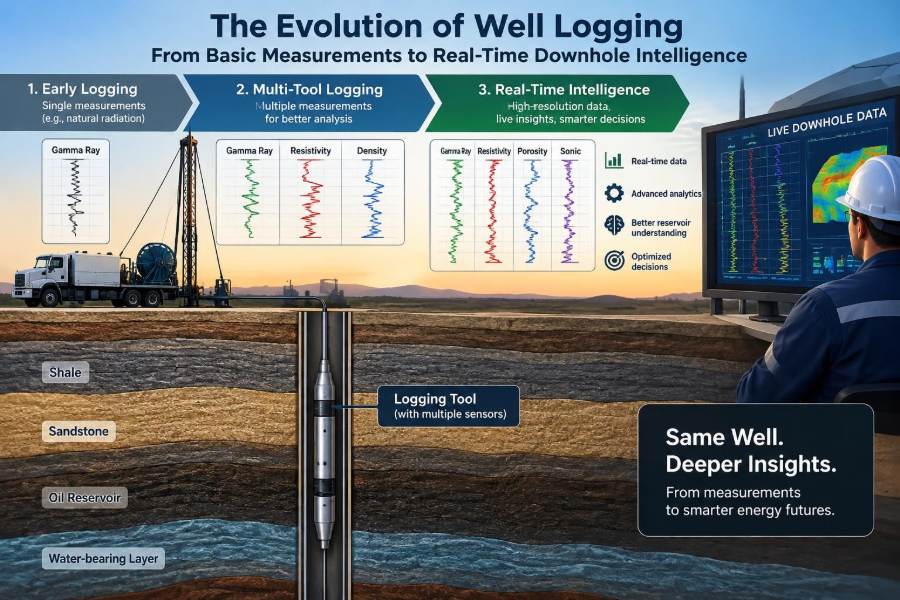
Well logging has evolved from relatively simple electrical traces recorded on paper to dense, continuously updated datasets that can support decisions at the rig. The change is not merely faster data delivery; it is a shift in how subsurface uncertainty is managed.
For students, well logging connects geology, petrophysics, drilling, reservoir engineering, and production. For working professionals, it remains one of the practical foundations of safe, technically defensible well decisions.
🧭 What Well Logging Actually Means
Well logging is the measurement of physical properties along the depth of a borehole. A logging tool senses a property of the rock, the fluids in and around the borehole, or the geometry and condition of the well itself.
The result is a log: a depth-indexed record, usually displayed as curves. A curve does not directly announce “oil,” “gas,” or “good reservoir.” It records a response that engineers interpret using physics, geological context, calibration data, and other measurements.
Think of it as examining a long, narrow core sample without recovering every piece of rock. The analogy is imperfect, because logs investigate volumes around the borehole rather than a physical cylinder in hand, but it captures their value: continuous information across intervals that core may not cover.
🕰️ Why the History of Logging Matters
Older logging methods established concepts that remain central: measure a physical response, correct for borehole conditions, compare curves, and test interpretations against independent evidence. Modern tools are more sophisticated, but they still face the same core question: what does a measured signal truly represent?
The history also explains why legacy data can still be valuable. An old spontaneous-potential or resistivity log may lack modern resolution, yet it can help identify formation boundaries, correlate wells, or support a regional interpretation when used within its limitations.
Understanding the progression prevents a common mistake: assuming a digital display automatically produces a more reliable geological answer than a carefully interpreted conventional log.
⚡ The Early Electrical Log
The earliest electrical logging work demonstrated that formations could be distinguished by their electrical behavior. Rocks containing conductive water generally respond differently from resistive hydrocarbon-bearing formations, although lithology, salinity, invasion, and borehole effects complicate that simple picture.
Early electrical logs were transformative because they offered a continuous downhole record rather than relying only on drill cuttings, which are mixed, delayed, and often difficult to assign precisely to depth.
They also introduced a lasting principle: a tool response must be tied to formation conditions. A high-resistivity interval might indicate hydrocarbons, but it can also reflect tight rock, fresh formation water, certain minerals, or measurement effects.
🌊 Spontaneous Potential and Formation Boundaries
The spontaneous potential, or SP log, measures naturally occurring electrical potential differences between the borehole and surrounding formation. In suitable conditions, it commonly shows contrasts between permeable beds and adjacent shale.
SP is particularly useful for identifying bed boundaries and estimating shale baselines in water-based mud systems. Its response depends on electrochemical conditions, including the contrast between mud-filtrate and formation-water salinity.
It is not a universal shale detector. Oil-based mud, low salinity contrast, very resistive formations, thick mudcake, and complex mineralogy can weaken or distort the signal. An apparently quiet SP curve should not be interpreted as proof that permeability is absent.
📏 Depth: The Reference Every Log Needs
A log only becomes useful when its depth is trustworthy. Every reservoir contact, perforation interval, core plug, pressure point, and casing collar is referenced to a depth system.
Wireline depth is commonly derived from cable movement, while logging-while-drilling depth is tied to measured drilling depth and drillstring movement. Each may require adjustments for stretch, rig datum, pipe movement, and operational conditions.
Depth matching aligns different logs to recognizable features so that curves represent the same formation interval. A small mismatch can create a false interpretation—for example, placing a resistivity peak beside rather than within a porous zone.
🪨 Gamma Ray and Natural Radioactivity
The gamma ray log measures natural gamma radiation from formations. Shales often have elevated responses because they may contain potassium-bearing clays or uranium- and thorium-associated minerals.
This makes gamma ray a widely used indicator of shale content and a practical correlation tool. It is recorded in open hole, through casing in many situations, and while drilling, giving it an unusually broad operational role.
But “high gamma ray equals shale” is a useful shortcut, not a law. Radioactive clean sands, feldspathic rocks, granitic intervals, organic-rich shales, and certain mineral accumulations can challenge the interpretation. Core, cuttings, spectral gamma data, and regional geology help resolve ambiguity.
🧱 Density Logging and Bulk Density
A density tool uses a radioactive source and detectors to estimate bulk density, the density of rock matrix, pore fluids, and pore space combined. In a clean formation with known mineralogy, bulk density can be converted into an estimate of porosity.
Density is especially valuable because it also responds to lithology. Limestone, dolomite, and sandstone have different matrix densities, so the assumed matrix must fit the geological model.
Borehole rugosity, mudcake, barite-weighted mud, and poor pad contact can degrade the measurement. Quality indicators such as caliper information and density correction curves should be examined before treating a density-derived porosity as precise.
🔬 Neutron Logging and Hydrogen Index
Neutron logs respond primarily to hydrogen concentration, often described through the hydrogen index. Because water and oil contain substantial hydrogen, neutron response is commonly related to porosity in water- or oil-filled formations.
Gas has a much lower hydrogen density than liquid-filled pore space. In a gas-bearing reservoir, neutron porosity may read anomalously low while density-derived porosity may appear high, creating the familiar density-neutron crossover.
That crossover is a useful clue, not conclusive proof of gas. Lithology changes, light hydrocarbons, shale effects, and environmental corrections can also influence the relationship. Interpretation should include resistivity, borehole conditions, and, where available, pressure or fluid-sampling evidence.
🧩 Combining Density and Neutron Responses
Density and neutron logs are more informative together than alone because they sense different physical properties. Their agreement can support a porosity estimate; their separation can highlight gas, shale, lithology variation, or a problematic borehole environment.
In a clean, liquid-filled limestone, the two curves may align after appropriate scaling. In real formations, however, mixed minerals and clay-bound water make the picture less tidy.
A practical workflow is to first assess hole quality, then identify likely lithology, and only then interpret porosity and fluid effects. Starting with a gas conclusion before checking these conditions is a frequent interpretive error.
🌐 Resistivity and Fluid Saturation
Resistivity logging is central to hydrocarbon evaluation because saline formation water tends to conduct electricity, while hydrocarbons are comparatively resistive. A resistivity log therefore contributes to estimates of water saturation, the fraction of pore volume occupied by water.
The relationship is often represented using petrophysical models such as Archie’s equation in clean, water-wet formations. Shaly sands need additional treatment because conductive clays can contribute electrical current that Archie’s basic form does not capture.
Resistivity is not a direct oil-and-gas detector. Fresh water, tight formations, variable salinity, conductive minerals, and invasion by drilling-fluid filtrate can all alter the response. Good saturation work starts by understanding the formation-water system and selecting a model that fits the rock.
🎯 Shallow, Medium, and Deep Investigation
Resistivity tools investigate different distances from the borehole. Shallow measurements are more influenced by the invaded zone, where mud filtrate has entered the formation; deeper measurements aim to represent rock farther from this disturbance.
The separation between shallow and deep readings may reveal invasion behavior, permeability-related effects, or challenging environmental conditions. It can also be influenced by thin beds and tool response characteristics.
The goal is not simply to choose the largest resistivity value. It is to estimate the undisturbed formation response, commonly called true resistivity, with an understanding of how the borehole has altered the near-wellbore region.
📡 Sonic Logging and Acoustic Travel Time
Sonic tools measure the travel time of acoustic waves through formation. Compressional-wave slowness can be related to porosity, particularly in clean formations with an appropriate rock-physics relationship.
Sonic data also support mechanical interpretation. Compressional and shear-wave measurements, combined with density, can help estimate elastic properties used in geomechanical models, wellbore-stability analysis, and fracture-design planning.
These estimates are model dependent. A sonic log does not directly deliver rock strength, and dynamic elastic properties measured at acoustic frequencies may differ from the static properties observed in laboratory mechanical tests.
🕳️ Caliper Logs and Borehole Reality
A caliper log measures borehole diameter. It may seem less glamorous than nuclear or resistivity data, but it often explains why another log cannot be trusted.
An enlarged hole can indicate washout, commonly associated with weak or reactive shale. A smaller effective diameter may indicate mudcake. Breakouts and irregular geometry can also point toward stress-related wellbore behavior.
Caliper information should be reviewed early, not as an afterthought. If a density pad loses contact in a washed-out interval, an elegant porosity calculation based on that density response may be technically weak.
🧲 Dipmeter to Borehole Imaging
Dipmeters measured the orientation of bedding planes from multiple pad-based resistivity readings. They helped interpreters estimate structural dip and distinguish true stratigraphic thickness from apparent thickness in deviated wells.
Modern borehole imaging tools provide much richer, circumferential views of the borehole wall. Electrical images generally require conductive mud, while acoustic images can be used in a wider range of fluid systems, though each has distinct resolution and environmental limitations.
Images can reveal bedding, fractures, vugs, breakouts, drilling-induced fractures, and sedimentary features. Their interpretation requires caution: a feature on an image is a response pattern that must be distinguished from tool marks, mud effects, or processing artifacts.
🧪 Formation Testing and Direct Fluid Evidence
Wireline formation testers can seal against the borehole wall, withdraw a small volume of fluid, measure pressure, and sometimes collect samples. Pressure gradients can help identify fluid contacts and assess reservoir connectivity.
Fluid samples add a type of evidence that conventional logs cannot provide alone. They may help distinguish oil, gas condensate, water, or contaminated filtrate, subject to sample quality and operational constraints.
Sampling is not automatically representative. Low permeability, poor seal quality, filtrate contamination, multiphase behavior, and inadequate cleanup can affect results. A pressure point or sample should be integrated with logs, geology, and completion context.
🪢 Wireline Logging: Detailed Measurement After Drilling
Wireline logging deploys tools on an electrical cable after a section has been drilled, or sometimes through tubing or casing during later well life. The cable provides power, communication, and depth control.
Its major advantage is access to a broad suite of sophisticated tools, often with high data quality under stable borehole conditions. It can also be run selectively when the drilling team needs answers before deciding whether to case, sidetrack, or complete an interval.
Its limitations are operational. The well must be in a condition that allows conveyance, and a tool may struggle to reach target depth in highly deviated or horizontal open holes without tractors, drillpipe conveyance, or other methods.
🛞 Logging While Drilling Changes the Timing
Logging while drilling, or LWD, places sensors near the drill bit in the bottomhole assembly. Measurements are acquired as the well advances, allowing formation evaluation to influence drilling decisions before the borehole condition changes or the bit moves far beyond the target.
Measurements are transmitted to surface through mud-pulse telemetry, electromagnetic telemetry in some settings, or retrieved later from downhole memory. Telemetry bandwidth is limited, so real-time data may be compressed, sampled less densely, or sent as selected products.
The defining advantage is timing. In a thin target with uncertain structure, knowing the likely approach to a boundary while drilling can be more valuable than obtaining a more complete answer after the well has already crossed it.
🧭 Geosteering in Thin and Complex Reservoirs
Geosteering uses real-time directional and formation measurements to keep a wellbore within a desired stratigraphic interval. It is common in horizontal development where the productive layer may be thin, folded, faulted, or structurally uncertain.
Azimuthal gamma ray and resistivity tools can indicate directional changes in formation properties around the borehole. Deep-reading resistivity measurements may sense boundaries above, below, or beside the wellbore before the bit reaches them, depending on tool design and geological conditions.
Imagine a horizontal well intended to remain several metres below a shale roof. If real-time boundary information suggests the roof is approaching, the team can alter inclination or trajectory. That is a hypothetical example, but it describes the practical logic of geosteering.
📶 Real-Time Data Is Not the Same as Instant Certainty
Real-time operations compress the decision cycle: acquire data, transmit it, quality-check it, update the geological model, and recommend an action. This is powerful, but the speed of the loop can create pressure to overinterpret early signals.
Data may be delayed, affected by telemetry gaps, altered by drilling dynamics, or subject to later processing improvements. The first curve at surface is often an operational product, not the final processed and depth-matched dataset.
Effective teams communicate confidence explicitly. Rather than saying “the contact is here,” they may state that current measurements suggest an approaching boundary, identify the uncertainty range, and explain what additional observation would confirm or challenge the interpretation.
🧠 From Individual Curves to Integrated Petrophysics
Petrophysics turns log responses into estimates of properties such as shale volume, porosity, permeability indicators, and water saturation. It is an integration discipline, not a single-log exercise.
A typical evaluation begins with depth alignment and environmental quality control. The interpreter then establishes lithology and shale behavior, selects porosity and saturation models, applies appropriate corrections, and compares results with core, mud logs, pressure data, tests, and production where available.
The output should preserve uncertainty. A net-pay calculation depends on cutoffs for porosity, water saturation, shale volume, and permeability or mobility. Those cutoffs need geological and economic justification; they are not universal numbers that can be copied blindly between fields.
🧮 Algorithms, Inversion, and Machine Learning
Modern workflows use automated quality control, statistical classification, inversion, and machine-learning methods to handle large logging datasets. These tools can identify patterns, accelerate repetitive tasks, and help reconcile multiple measurements with a geological model.
Inversion works backward from measured tool responses to estimate subsurface properties that could have produced them. Because more than one geological scenario can sometimes explain the same measurement, inversion depends on constraints and assumptions.
Machine-learning models face a similar issue. A model trained on one basin, lithology, mud system, or tool generation may perform poorly elsewhere. Automation is most useful when it makes assumptions visible and gives domain specialists a clear way to review exceptions.
🧱 The Resolution Problem in Thin Beds
Every logging tool has a vertical resolution and a depth of investigation. If a reservoir bed is thinner than the tool’s response length, adjacent shale or nonreservoir layers can influence the recorded value.
This is called shoulder-bed effect. A thin resistive sand between conductive shales may look less resistive than it truly is, while a thin porous bed can appear to have lower porosity or more shale than the formation itself.
High-resolution tools, image logs, forward modelling, and deconvolution can improve interpretation, but none eliminate physics. The correct response is to quantify the limitation and avoid treating a blended measurement as a precise bed property.
🌡️ High Pressure, High Temperature, and Harsh Environments
Deep, hot, high-pressure wells place severe demands on sensors, electronics, seals, batteries, and telemetry. Tool ratings, operating time, vibration exposure, and drilling-fluid conditions all affect what can be safely and reliably measured.
Harsh environments can also change the formation-evaluation challenge. In some reservoirs, salinity, gas effects, anisotropy, invasion, or complex mineralogy make conventional interpretation relationships less reliable.
Planning should begin with the decision required, then select tools and contingencies that fit the environment. Running a sophisticated measurement that cannot survive the expected conditions is not a robust data-acquisition plan.
🧯 Safety, Well Control, and Operational Awareness
Logs can support safety-critical decisions, especially when they help identify formation changes, pore-pressure trends, fluid contacts, or wellbore instability indicators. They are one input among many, alongside drilling parameters, mud properties, cuttings, flow checks, and established well-control procedures.
Pore-pressure interpretation from logs is inherently uncertain and depends on regional calibration, compaction behavior, and data quality. It should not be reduced to a single curve threshold.
Operational teams need clear escalation rules. If measurements indicate an unexpected formation change or a potentially unstable interval, the response must follow the well program and site procedures rather than rely on an informal interpretation alone.
🔄 Cased-Hole Logging Extends the Story
Logging does not end when casing is run. Cased-hole tools can evaluate cement placement, casing integrity, fluid movement behind pipe, reservoir saturation changes, and production or injection profiles.
Production logging tools may measure flow, temperature, pressure, density, or fluid holdup under flowing conditions. These data can reveal whether a completion is contributing as expected, taking unwanted water, or experiencing crossflow.
The physics and resolution differ from open-hole logging, and steel casing limits what can be measured. Still, cased-hole surveillance transforms logs from an exploration and appraisal tool into a life-of-well diagnostic system.
📊 A Practical Comparison of Logging Stages
| Stage | Typical focus | Main strength | Key limitation |
|---|---|---|---|
| While drilling | Positioning, formation change, immediate decisions | Information arrives while trajectory can still be adjusted | Telemetry and tool placement can limit data detail |
| Open-hole wireline | Detailed petrophysics, imaging, pressure, sampling | Broad tool selection and specialized measurements | Requires suitable borehole access and conveyance |
| Cased-hole surveillance | Completion performance and integrity | Monitors the well after completion | Casing restricts some formation measurements |
No stage replaces the others in every well. The strongest program matches acquisition timing and measurement type to the decisions that carry the most technical or economic risk.
⚠️ Common Interpretation Mistakes
Many logging failures are not tool failures. They occur when a valid measurement is used outside the conditions where its interpretation is valid.
- Treating one curve as decisive: a gamma ray, resistivity, or crossover should be tested against other evidence.
- Ignoring borehole quality: washouts, mudcake, invasion, and eccentric tools can distort responses.
- Using default parameters without calibration: matrix density, water resistivity, clay model, and cutoffs must suit the reservoir.
- Forgetting scale: a tool investigates a finite volume, while core plugs and production tests sample different volumes.
- Confusing apparent precision with accuracy: multiple decimal places do not remove model uncertainty.
A disciplined interpretation records assumptions, explains alternatives, and identifies the data that would most reduce uncertainty.
🛠️ Designing a Fit-for-Purpose Logging Program
A logging program should begin with decisions, not a catalogue of tools. Ask what must be known before casing, where the expected uncertainty lies, what formation conditions may compromise measurements, and what evidence will be available for calibration.
For example, a simple vertical appraisal well may prioritize lithology, porosity, saturation, pressure, and fluid samples. A long horizontal development well may place greater weight on real-time directional measurements, boundary detection, and geosteering support.
Contingency planning matters. Consider what happens if the hole deteriorates, telemetry becomes unreliable, a tool cannot reach depth, or a target interval is thinner than expected. A smaller but robust acquisition plan can be more useful than an ambitious plan that cannot be executed.
👥 The Human System Behind Downhole Intelligence
Real-time downhole intelligence depends on collaboration among drillers, directional drillers, mud loggers, geologists, petrophysicists, reservoir engineers, and service specialists. Each discipline sees a different part of the problem.
The best operational discussions separate observations from interpretations. “Deep resistivity is increasing” is an observation. “We are entering the target reservoir” is an interpretation that should be weighed against trajectory, geology, gamma ray, cuttings, and other evidence.
Clear handovers, shared depth references, and documented decision logic are as valuable as advanced sensors. Data loses value quickly when the team cannot establish which version is current or why a trajectory decision was made.
🔮 Where Well Logging Is Heading
Future progress is likely to come from tighter integration: better downhole sensors, improved telemetry, more automated quality control, richer geological models, and workflows that connect drilling-time measurements with completion and production data.
Distributed sensing with fiber-optic systems, permanent monitoring, and repeated surveillance can add time-dependent information that conventional snapshot logs cannot provide. Their usefulness will depend on installation quality, interpretation capability, and whether they answer a real operational question.
The direction is toward a more continuously observed well, but not a fully self-interpreting one. Complex reservoirs will continue to require geological judgment, physical understanding, and honest treatment of uncertainty.
✅ The Core Takeaway: Measure, Integrate, Decide
The evolution of well logging is a story of increasing measurement capability: from basic electrical contrasts to images, pressure points, samples, directional sensing, and real-time boundary detection. Each advance gives engineers a clearer view of a place they cannot directly observe.
Yet the essential workflow has not changed. Measure the formation carefully, understand the tool physics and borehole environment, integrate independent evidence, and make decisions that reflect both value and uncertainty.
Real-time downhole intelligence is most powerful when it improves the quality and timing of decisions—not when it encourages teams to mistake a fast answer for a certain one.
Well logging delivers its greatest value when sound measurements, geological context, and disciplined engineering judgment work together. That principle links the first electrical logs to the most advanced downhole systems now guiding wells in real time. 🛢️📡🧭