
A production report arrives each morning with oil, water, gas, pressure, and uptime figures. A well may still be making an acceptable oil rate, yet one number has changed enough to make an engineer pause: the gas-oil ratio.
Is the well beginning to produce free gas from the reservoir? Has a gas cap reached the perforations? Is gas coning from above, or is the apparent increase simply a measurement problem at the separator?
Gas-oil ratio, usually shortened to GOR, is more than a production-accounting value. Read in context, it can reveal changing flow conditions near the wellbore, depletion behavior in the reservoir, artificial-lift problems, and constraints in surface facilities.
The key word is context. A high GOR is not automatically bad, and a low GOR is not automatically healthy. The trend, the fluid system, pressure data, completion design, and operating conditions determine what the number actually means.
🧭 The Basic Meaning of Gas-Oil Ratio
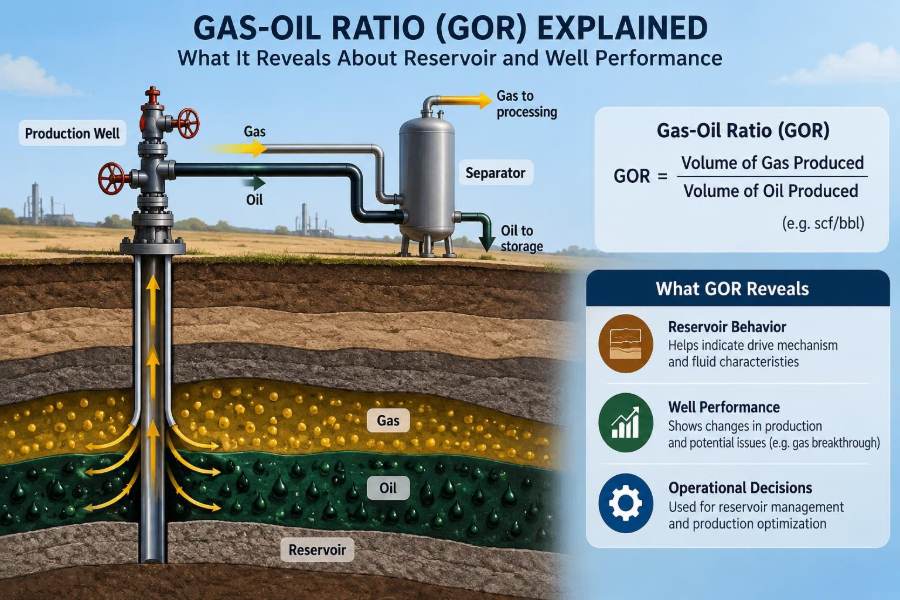
Gas-oil ratio is the volume of gas produced for each volume of oil produced. Field production GOR is commonly reported as standard cubic feet of gas per stock-tank barrel of oil, written as scf/STB.
“Standard” matters because gas volume changes greatly with pressure and temperature. Reporting gas at defined standard conditions allows production from different days, wells, and facilities to be compared consistently.
If a well produces 500,000 standard cubic feet of gas and 1,000 stock-tank barrels of oil in one day, its producing GOR is 500 scf/STB. That calculation is simple; interpreting it is the real engineering task.
📏 The Equation and Its Measurement Basis
The production or field GOR is expressed as GOR = qg / qo, where qg is gas rate at standard conditions and qo is oil rate measured as stock-tank oil.
Stock-tank oil is the liquid remaining after produced fluid has passed through separation and stabilization. It is not exactly the same volume as the oil that existed at reservoir pressure, where dissolved gas can make the oil phase larger.
For a meaningful ratio, gas and oil must be allocated to the same well and the same time interval. Mismatched test periods, estimated gas allocation, or unstable separator operation can create a convincing-looking but misleading GOR trend.
🔬 Producing GOR Is Not Solution GOR
A common source of confusion is treating all “GOR” terms as interchangeable. Solution gas-oil ratio, usually written Rs, describes gas dissolved in reservoir oil at a specified pressure and temperature.
Producing GOR describes what reaches the surface: dissolved gas released from oil, plus any free gas flowing with the produced fluids. Therefore, producing GOR can be higher than the solution GOR when a separate gas phase enters the well.
Laboratory PVT data—pressure-volume-temperature data—help establish the expected solution-gas behavior. A production test shows the well’s actual combined output. One is a fluid-property relationship; the other is a field-performance observation.
🧪 Bubble Point Sets a Crucial Boundary
The bubble-point pressure is the pressure at which the first bubble of gas comes out of solution from an undersaturated oil as pressure declines at reservoir temperature. Above bubble point, all gas may remain dissolved in the oil.
Below bubble point, free gas can appear in the reservoir. It does not necessarily flow immediately, because disconnected gas bubbles may remain trapped until gas saturation becomes high enough for gas to become mobile.
This distinction explains why a reservoir can be below bubble point without an immediate large rise in producing GOR. The response depends on saturation, relative permeability, pressure drawdown, and the path fluids take to the well.
🪨 What Reservoir Fluid Type Changes
GOR cannot be interpreted without knowing the reservoir fluid system. A conventional black-oil reservoir, volatile-oil reservoir, gas-condensate reservoir, and oil reservoir with a large gas cap can show very different behavior.
| Fluid system | Typical interpretation focus |
|---|---|
| Black oil | Depletion below bubble point and free-gas mobility may strongly affect GOR. |
| Volatile oil | Compositional changes and large gas liberation can make simple black-oil assumptions less reliable. |
| Oil with gas cap | Gas-cap encroachment, coning, or cresting may elevate producing GOR. |
| Gas condensate | Gas is the dominant produced phase; condensate-gas ratio is often the more natural companion metric. |
Fluid samples and representative PVT analysis are therefore foundational. Without them, an engineer may compare a well to an inappropriate “normal” GOR.
📉 Why GOR Often Rises During Depletion
As reservoir pressure falls, oil can retain less dissolved gas. Gas evolves from the oil, and eventually some of that free gas becomes mobile and reaches producing wells.
When gas relative permeability increases near the wellbore, gas can move disproportionately easily compared with oil. The produced stream then becomes progressively gassier, while oil relative permeability may decline.
This is a common depletion pattern, but it is not universal. Strong pressure support from water injection, gas reinjection, or aquifer influx can alter both the timing and size of the GOR response.
🌊 Gas Coning and Gas Cresting
Where a gas cap overlies the oil column, excessive drawdown can pull gas downward toward the well. This localized upward movement of gas into perforations is commonly called gas coning.
In a more laterally extensive or structurally controlled movement, gas may advance as a crest toward the well. Both mechanisms can cause a rapid GOR increase, often accompanied by falling oil productivity.
High production rate is not the sole cause. Vertical permeability, anisotropy, completion interval, distance to the gas-oil contact, and well trajectory all influence the risk. A horizontal well placed too close to the gas cap can be particularly sensitive.
🧱 Relative Permeability Explains the Flow Shift
Relative permeability describes how easily each fluid phase flows when other phases are also present. It is not an intrinsic property of the rock alone; it changes with fluid saturation and wettability.
Near a producing well, pressure declines sharply. If gas saturation rises in that region, gas relative permeability may increase while oil relative permeability falls. The well can then produce more gas even if the reservoir still contains substantial oil.
This is why GOR is a mobility signal as well as a fluid-composition signal. The produced mixture reflects which phases can move most effectively through the rock under current conditions.
🕳️ Drawdown Can Change the Story
Drawdown is the difference between average reservoir pressure and flowing bottomhole pressure. Increasing drawdown may raise oil rate in the short term, but it can also promote gas liberation or gas influx near the well.
For a saturated oil reservoir, aggressively lowering flowing pressure can create a highly gas-saturated zone around the perforations. That zone may reduce oil mobility and raise producing GOR.
The practical question is not whether drawdown is “high” in isolation. It is whether the incremental oil gained justifies the change in gas handling, oil productivity, recovery efficiency, and longer-term well behavior.
🧰 Completion Design Influences GOR
Perforation placement determines where the well communicates with the reservoir. Perforating close to a gas-oil contact can expose a well to early gas breakthrough, especially when vertical flow paths are favorable.
Long intervals may increase productivity but can also connect heterogeneous layers with different pressures and fluid saturations. A gas-prone upper layer can dominate the produced stream even while lower layers still contain more favorable oil mobility.
Selective perforation, isolation of problem intervals, and careful placement of horizontal laterals can help manage gas entry. These choices require reservoir understanding; they are not automatic fixes for every high-GOR well.
🧭 Natural Fractures and High-Permeability Paths
Reservoir fluids rarely move through perfectly uniform rock. Natural fractures, faults, thief zones, and high-permeability streaks can provide fast paths for gas.
Gas has low viscosity and can exploit such paths readily. A well may show an unexpectedly early GOR rise if it is connected to a gas source through a fracture network or a high-permeability channel.
Production logging, pressure-transient interpretation, tracer work where appropriate, and geological data can help distinguish channeling from ordinary depletion. A field-wide average GOR may conceal these localized connections.
🧯 Gas Breakthrough in Injected-Gas Projects
Gas injection can support pressure, displace oil, maintain miscibility under suitable conditions, or recycle produced gas. But injected gas can also arrive early at a producer through preferential flow paths.
An abrupt rise in GOR after injection changes may indicate breakthrough, although timing alone does not prove it. Engineers compare injection rates, pressure response, offset-well behavior, fluid composition, and reservoir-model predictions.
Early breakthrough can reduce sweep efficiency because injected gas cycles through a limited volume instead of contacting more oil. Responses may include injection redistribution, conformance control, rate adjustments, or changes in producer operating conditions.
🏭 Surface Separation Can Distort the Number
Not every GOR change originates underground. Separator pressure, temperature, liquid level control, sampling practice, meter calibration, and allocation methods all affect reported oil and gas volumes.
For example, changing separator pressure can alter how much gas flashes from the liquid in the facility. The stock-tank oil volume may also shift slightly, changing the calculated ratio even if reservoir inflow has not changed.
Before diagnosing a reservoir problem, verify the production test. Check whether the well was stable, whether gas was correctly assigned, and whether recent facility changes affected the measurement basis.
🧾 Allocation Errors Create False Trends
In commingled production systems, individual well gas rates are often allocated rather than directly metered continuously. Allocation may use periodic well tests, models, or assumptions about phase behavior.
A faulty test, an intermittent well, or a changing flow regime can make one well appear gasier at the expense of another. This is especially consequential when decisions depend on subtle month-to-month GOR movement.
Useful quality checks include comparing test data with daily totals, reviewing separator and choke conditions, and looking for simultaneous unexplained changes across several wells. A trend should be trusted only as much as its measurement chain.
📊 Why a Trend Matters More Than One Reading
A single GOR value is a snapshot. A time series reveals direction, speed, repeatability, and relationship to operational events.
Plot GOR with oil rate, gas rate, water cut, flowing pressure, choke size, downtime, and intervention dates. A rising GOR caused by declining oil rate may have a different meaning than one caused by a sharp increase in gas rate.
Short-term fluctuations can result from unstable flow or testing noise. A sustained trend across stable operating periods deserves more weight, particularly if it aligns with pressure decline or a nearby injection change.
🔍 Read GOR Alongside Oil and Gas Rates
GOR is a ratio, so the same increase can arise through different mechanisms. Suppose a hypothetical well moves from 300 to 600 scf/STB. That could happen because gas rate doubled, because oil rate halved, or because both changed.
Those cases imply different priorities. Rising gas with steady oil may strain gas handling but preserve oil deliverability. Falling oil with modestly changing gas may indicate worsening oil mobility, liquid loading behavior, or a completion problem.
- Gas up, oil steady: investigate gas influx, breakthrough, and facility capacity.
- Oil down, gas steady: examine productivity loss, drawdown, and liquid-flow conditions.
- Gas up, oil down: assess gas coning, channeling, or near-wellbore phase changes.
💧 Water Cut Adds Another Diagnostic Layer
Water cut is the fraction of produced liquid that is water. It does not diagnose gas behavior directly, but its trend can sharpen interpretation.
A rising GOR with stable water cut may point toward gas-cap influence, depletion, or gas breakthrough. Rising water cut and rising GOR together can occur in complex layered systems, changing contacts, or wells experiencing multiple flow problems.
Do not force a simple pattern onto every well. Water and gas may enter through different zones, and a completion can produce all three phases through separate pathways.
🧪 PVT Data Connects Surface Output to Reservoir Behavior
PVT studies provide bubble-point pressure, solution GOR, oil formation volume factor, gas formation volume factor, viscosity, density, and other properties used to model phase behavior.
These properties help answer whether a measured producing GOR is physically plausible at the estimated reservoir pressure. They also support material-balance calculations, nodal analysis, and reservoir simulation.
PVT samples must be representative. Contamination, poor sampling, or failure to preserve sample pressure can lead to incorrect fluid characterization. When production behavior disagrees with old PVT data, both the field interpretation and the sample quality deserve review.
🧠 Nodal Analysis Shows the Whole Production System
A reservoir may deliver a gas-rich stream, yet the well’s performance also depends on tubing, choke, flowline, separator pressure, and artificial lift. Nodal analysis connects inflow from the reservoir to outflow through the production system.
As GOR changes, fluid density, pressure gradients, and multiphase-flow behavior in the tubing change too. In some wells, added gas can assist lifting; in others, unstable flow, excessive backpressure, or facility constraints can limit production.
This system view prevents a narrow diagnosis. A high GOR may originate in the reservoir, but the most practical response may involve surface pressure, lift design, or flow assurance rather than a reservoir intervention.
⬆️ GOR and Artificial Lift Performance
Free gas can significantly affect artificial-lift equipment. In rod-pumped wells, gas interference can reduce pump fillage because gas occupies volume that would otherwise be filled with liquid.
In electrical submersible pump systems, excessive free gas at the pump intake can reduce head generation and contribute to unstable operation. Gas separators, intake placement, operating adjustments, or redesigned equipment may be considered depending on the well.
Gas lift uses injected gas intentionally, so its interpretation requires extra care. Total produced gas includes reservoir gas and lift gas; engineers often track a produced GOR and an injected-gas-adjusted view to avoid confusing lift operations with reservoir change.
⚙️ High GOR Can Become a Facility Constraint
More gas increases the load on separators, compressors, dehydration systems, flare systems where permitted, gas sales lines, and emissions-control equipment. A well that appears attractive on oil rate may be limited by gas capacity.
Backpressure can rise if downstream gas handling is constrained, reducing well deliverability. Gas-rich production may also complicate liquid measurement and separation, reinforcing the need for reliable test conditions.
Operational decisions should consider the entire asset. Choking back one high-GOR well can sometimes protect total field oil production when shared gas handling is the bottleneck, though the value of that choice depends on the specific constraints.
🌱 Emissions and Safety Implications
Produced gas is valuable when captured and used or sold, but it must be handled safely. Uncontrolled releases can create fire, explosion, exposure, and environmental risks, while methane emissions are a significant climate concern.
High-GOR wells demand robust containment, monitoring, pressure protection, and operating discipline. Venting and flaring practices are governed by site-specific operating requirements and regulations, which vary by jurisdiction.
Production optimization should therefore include gas capture and handling capability—not merely the oil-rate target. A technically successful well plan must remain safe and operable.
🩺 Diagnosing a Sudden GOR Increase
A sudden change deserves a structured investigation. Start by determining whether it is real: confirm meter performance, separator conditions, allocation, test stability, and whether the well experienced a choke, lift, or routing change.
If the increase is confirmed, compare it with flowing pressure, oil and gas rates, water cut, nearby injection activity, and offset-well trends. Production logging or pressure data may be needed when the likely source is unclear.
- Validate the measurement and time basis.
- Identify operational changes that coincide with the trend.
- Separate gas-rate growth from oil-rate decline.
- Test reservoir and completion hypotheses using supporting data.
- Select a response only after identifying the most credible mechanism.
🛠️ Practical Responses Depend on the Cause
There is no universal “GOR treatment.” If excessive drawdown is promoting gas coning, reducing drawdown through rate or choke management may help, although it can sacrifice short-term production.
If a specific interval is producing gas, mechanical isolation, reperforation, or selective completion work may be evaluated. If gas is breaking through from injection, conformance work or injection-pattern changes may be more relevant.
When the reservoir mechanism cannot be economically changed, the best response may be operational: improve gas compression, optimize separation, adjust artificial lift, or manage production within facility limits. Economics, reserves impact, and intervention risk all matter.
🚫 Common Interpretation Mistakes
The most frequent mistake is declaring a high GOR “bad” without establishing the baseline for that fluid system and well. Some reservoirs naturally produce at high ratios, and some wells are designed to handle substantial gas.
Other avoidable errors include:
- Comparing producing GOR directly with laboratory solution GOR without considering free gas.
- Using a single test point as proof of gas breakthrough.
- Ignoring changes in separator pressure, allocation, or gas-lift injection.
- Looking at the ratio without examining its numerator and denominator.
- Applying a field-wide explanation to a well with localized completion or fracture behavior.
Good interpretation is less about memorizing a “normal” number and more about testing competing explanations against reliable data.
🗺️ A Simple Hypothetical Well Example
Consider a hypothetical oil well producing 800 STB/d of oil and 400,000 scf/d of gas, for a GOR of 500 scf/STB. Several weeks after the choke is opened, oil rises briefly, then declines to 650 STB/d while gas increases to 650,000 scf/d.
The new GOR is 1,000 scf/STB. The doubled ratio is not just an arithmetic curiosity: gas rose while oil fell. If flowing bottomhole pressure also dropped substantially and the well is near a gas cap, gas coning becomes a credible hypothesis.
It remains a hypothesis. The engineer would still check test quality, gas-lift status, completion depth, pressure behavior, and nearby wells before reducing the choke or planning an intervention.
📚 Data a Production Engineer Should Keep Together
GOR becomes far more useful when data are stored on a consistent time basis and reviewed as an integrated set. A practical surveillance view often includes production, pressure, operations, and facility information.
- Oil, gas, water, and injection volumes
- Well-test conditions and allocation confidence
- Flowing tubing and bottomhole pressures where available
- Choke settings, artificial-lift settings, and downtime
- Separator pressure and routing changes
- Completion intervals, workover history, and nearby injection activity
Clear records turn a GOR plot from a retrospective report into an early-warning tool. They also make handovers and cross-disciplinary reviews more reliable.
🤝 Reservoir, Production, and Facility Teams Need One View
Reservoir engineers assess pressure depletion, contacts, fluid behavior, and sweep. Production engineers focus on well deliverability, lift, surveillance, and interventions. Facility teams understand separation, compression, constraints, and measurement.
A GOR problem can sit at the intersection of all three. For example, lowering separator pressure may improve well deliverability but alter flashed gas volumes and compression demand; choking a well may reduce coning risk but affect field throughput.
The strongest decisions make these trade-offs visible. Shared plots, agreed definitions, and explicit uncertainty help teams avoid optimizing one part of the system at the expense of another.
🎓 What GOR Ultimately Reveals
Gas-oil ratio is a compact signal of a much larger system: reservoir phase behavior, rock-fluid flow, well completion, operating drawdown, lift performance, and surface handling all leave their mark on it.
Its greatest value comes from comparison—against the well’s own history, PVT expectations, offset wells, pressure data, and known operational changes. Used alone, it can mislead. Used with supporting evidence, it helps engineers recognize changing well behavior early enough to investigate and respond.
The core principle is simple: GOR is not a verdict on well performance; it is a diagnostic clue whose meaning emerges from the full reservoir-to-facility picture.
A rising or falling ratio should prompt a better question, not a rushed conclusion: what changed in the fluids, the reservoir, the well, or the measurement system? Following that question systematically is what turns a routine production number into useful engineering insight. 🛢️📈🔧