
A production operator receives an alarm just before dawn: pressure on a well has begun to drift, while a nearby pump is drawing slightly more power than usual. Neither change is dramatic on its own. Together, they may signal a developing flow restriction, gas interference, or mechanical wear.
In an older operating model, the issue might not be noticed until the next field visit, a routine test, or a visible drop in production. By then, a small deviation could have become deferred production, a failed component, or an unnecessary shutdown.
Modern oilfields increasingly avoid that gap by using instruments, communication networks, and software that turn physical conditions into usable information. The objective is not to replace field personnel with screens. It is to help people see the reservoir, wellbore, and surface facilities more clearly between visits.
Real-time monitoring matters because petroleum operations are dynamic systems. Pressures change, fluids behave differently as conditions shift, equipment degrades, and operating decisions made in one part of the field can affect another. Good digital monitoring shortens the time between change, detection, understanding, and action.
🧭 What “Real Time” Actually Means in an Oilfield
Real time does not always mean that every value arrives every second. In petroleum operations, it generally means data are available quickly enough to support the decision being made.
A vibration sensor protecting a rotating pump may report at high frequency, while a tank level or well test value may only need periodic updates. The required speed depends on the hazard, process, and value of the information.
It is useful to think in three layers: measurement, transmission, and response. A fast sensor has limited value if the signal cannot reach the control system, or if nobody has defined what to do when it changes.
📡 The Basic Architecture Behind Digital Monitoring
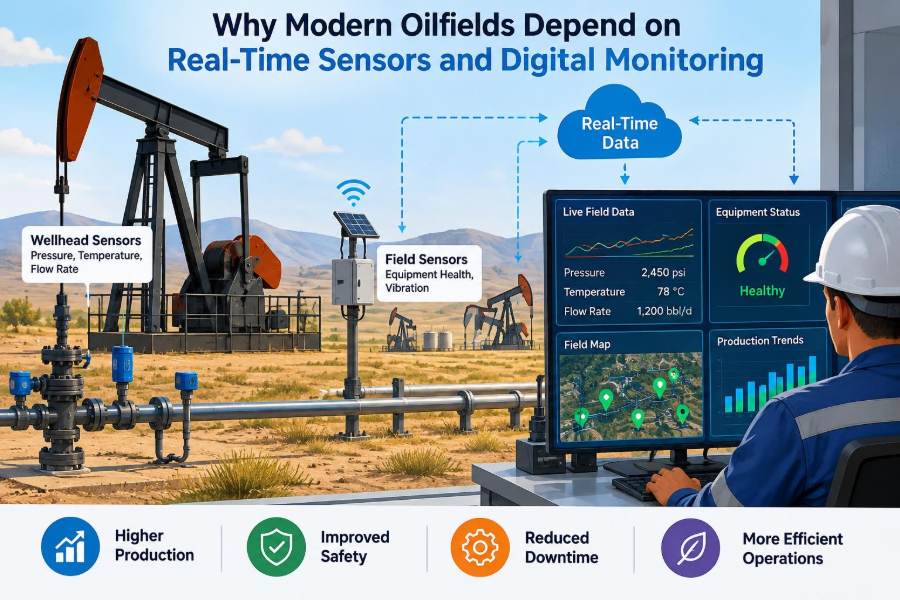
A typical system begins with field instruments measuring a physical variable. A controller, remote terminal unit, or programmable logic controller collects those signals and can execute local control logic.
Data then travel through wired, radio, cellular, satellite, or fiber connections to a supervisory system. Operators may view the information through SCADA, short for supervisory control and data acquisition, historian databases, dashboards, and engineering applications.
The architecture must be designed for the site. A remote pad with intermittent communications needs different buffering and alarm behavior from a continuously staffed processing facility.
🌡️ Pressure: One of the Most Valuable Measurements
Pressure reveals how fluids and gases move through reservoirs, tubing, flowlines, separators, and pipelines. A change can indicate a healthy operational response, but it can also point to a restriction, leak, valve position problem, or changing reservoir behavior.
Wellhead pressure is often watched alongside downstream line pressure. If the difference between them rises unexpectedly, operators may investigate a choke setting, flowline restriction, hydrate risk, or a measurement problem.
Pressure interpretation requires context. A lower flowing pressure can increase a well’s drawdown and production rate, but excessive drawdown may bring unwanted water, sand, gas, or reservoir damage in some completions.
🌡️ Temperature as a Process Clue
Temperature is more than an equipment-health measurement. It affects fluid viscosity, gas behavior, corrosion mechanisms, separation performance, and the formation of wax or hydrates under suitable conditions.
A temperature profile along a pipeline can help identify cooling zones where flow assurance problems may develop. In artificial-lift equipment, an unusual temperature trend may provide early evidence of electrical or mechanical stress.
Temperature sensors also need careful placement. A reading taken on the outer surface of insulated piping may not represent the fluid temperature accurately enough for a critical operating decision.
💧 Flow Measurement Connects Operations to Production
Flow meters estimate how much oil, gas, water, or injected fluid is moving through a defined point. The measurement can support allocation, production surveillance, chemical dosing, custody-related processes, and troubleshooting.
No single meter suits every fluid and operating condition. Multiphase flow, changing gas fraction, solids, low flow rates, and unstable flow can complicate measurement and interpretation.
For this reason, flow data are commonly compared with pressure, temperature, choke position, separator conditions, and periodic test data. A number on a dashboard is an estimate with a measurement context, not automatically a complete description of the well.
⚡ Electrical Data Reveal Artificial-Lift Health
Many wells rely on artificial lift, such as electric submersible pumps, rod pumps, gas lift, or progressive cavity pumps. Their performance often determines whether a well produces efficiently or spends time offline.
For electric systems, current, voltage, power, frequency, and motor temperature can show whether a pump is operating close to its intended envelope. Sudden deviations may indicate changing fluid load, electrical faults, gas handling issues, or mechanical resistance.
For rod pumping systems, surface load and position data can be converted into a dynamometer card. Engineers use its shape, together with fluid level and production information, to assess pump fillage and potential downhole conditions.
🔊 Vibration Monitoring Finds Mechanical Change Early
Rotating equipment such as compressors, pumps, generators, and motors produces vibration patterns during normal operation. Bearings, imbalance, misalignment, looseness, and other faults can alter those patterns.
Condition monitoring does not mean that every vibration increase predicts an immediate failure. It means a change can trigger a closer review before a minor defect becomes a damaging event.
Useful programs establish a baseline for each machine, account for speed and load, and combine vibration evidence with temperature, lubrication condition, maintenance history, and operator observations.
🧪 Sensors Support Safer Process Conditions
Oilfield facilities handle flammable hydrocarbons, pressurized equipment, chemicals, and sometimes sour fluids containing hydrogen sulfide. Sensors help personnel recognize hazardous conditions, but they are only one part of a broader safety system.
Gas detection, flame detection, pressure protection, emergency shutdown systems, and process alarms can provide warnings or initiate protective actions. Their design must consider sensor coverage, response time, testing, maintenance, and credible failure modes.
A detector should never be treated as permission to relax operating discipline. Safe work still depends on procedures, competent people, isolation practices, inspection, and a clear understanding of process hazards.
🛢️ Reservoir Surveillance Starts at the Surface
Reservoir behavior cannot be observed directly in most producing wells. Engineers infer it from pressure responses, rates, fluid properties, water cut, gas-oil ratio, tests, and geological understanding.
Continuous surface measurements improve the timeline of that interpretation. A sustained rise in water production, for example, may prompt review of completion performance, nearby injection activity, coning, channeling, or meter reliability.
Surface data do not eliminate uncertainty. They provide more frequent evidence that should be integrated with pressure surveys, production logging, well tests, reservoir models, and subsurface knowledge.
💉 Injection Monitoring Protects Sweep Efficiency
Water injection, gas injection, and other enhanced-recovery methods depend on moving fluids through the reservoir in a controlled way. Injection rate and pressure are central operating measurements.
An injector taking less fluid than expected may have a surface restriction, scale, plugging, changing injectivity, or a valve issue. A sharp pressure change may require attention because it can affect both operational targets and well integrity limits.
Digital surveillance helps teams compare injectors and producers over time. The goal is not merely to maximize injected volume; it is to inject within an approved and technically appropriate operating envelope.
🧰 Remote Well Control Reduces Routine Travel
Remote-controlled chokes, valves, variable-speed drives, and shutdown devices allow operators to adjust or secure equipment without traveling to every location for every routine change. This can be particularly useful across large, dispersed fields.
Less travel can reduce exposure to road hazards and free field personnel for inspections that require human judgment. It can also make response faster when weather, distance, or access delays would otherwise matter.
Remote control must have safeguards. Authorization levels, command confirmation, local override capability, fail-safe design, and clear communication with field crews are essential whenever equipment can move or change state remotely.
🖥️ SCADA Turns Signals into an Operating Picture
SCADA systems collect field data, display process status, issue alarms, and often support remote commands. Their value is strongest when screens show the relationships that operators need to understand, rather than presenting a wall of disconnected numbers.
A good well-pad display might show tubing and casing pressure, choke position, flow indication, chemical injection status, shutdown state, and recent trends. A facility display may add separator levels, compressor status, flare conditions, and transfer rates.
Trend charts are often more revealing than a single live value. A steady drift over several days can be operationally meaningful even when every instant remains inside its alarm limit.
🚨 Alarm Management Prevents the “Alarm Flood”
An alarm should identify a condition that needs timely operator attention. If hundreds of nuisance alerts arrive during a routine upset, the important one can be buried in noise.
Effective alarm management assigns priorities based on consequence and response time, removes duplicate or obsolete alarms, and defines a practical operator action for each meaningful alarm. Deadbands and delays can prevent repeated alerts caused by normal signal fluctuation.
Alarm limits are not substitutes for engineering limits. They should be reviewed as equipment, process conditions, and operating procedures change.
🧠 Data Historians Preserve the Operating Story
A data historian stores time-stamped process data so that teams can reconstruct what happened before, during, and after an event. This record is valuable for troubleshooting, production optimization, reporting, and incident learning.
Without reliable history, a team may rely on memories, manual notes, or isolated snapshots. Those sources are still useful, but they rarely show the sequence of small changes that preceded a significant outcome.
Historian configuration matters. Sampling frequency, compression rules, time synchronization, tags, units, and retention policies can all affect whether stored data are fit for later analysis.
🧹 Data Quality Comes Before Advanced Analytics
Digital systems can collect large volumes of data, yet poor-quality values can mislead an engineer faster than missing values. Common problems include drifting calibration, frozen signals, incorrect scaling, inconsistent units, communication dropouts, and manual entry errors.
A pressure tag stuck at one value may look reassuring unless the system flags it as stale. A flow value expressed in the wrong standard conditions can distort balances and allocation decisions.
Before applying sophisticated models, teams should ask basic questions: Is the sensor calibrated? Is the tag correctly labeled? Are timestamps aligned? Does the value agree with independent evidence?
🔧 Calibration Is Part of the Measurement System
A sensor is not permanently accurate simply because it was accurate when installed. Its performance can change because of wear, fouling, environmental exposure, impulse-line plugging, vibration, electrical issues, or process deposits.
Calibration and functional testing should reflect equipment criticality, service conditions, and the consequence of a bad measurement. A device used for a protective shutdown needs a different assurance approach from a noncritical advisory indicator.
Maintenance records should connect the instrument to its tag, range, location, test results, and any adjustments made. That traceability helps engineers judge whether a trend represents the process or the instrument.
📶 Communications Are Often the Weakest Link
Remote sites may face difficult terrain, limited power, radio interference, cellular coverage gaps, or satellite latency. A sophisticated sensor network is only useful if data can arrive reliably enough for its purpose.
Designers commonly use local control and data buffering so that a site remains stable during a communication outage. When the connection returns, stored data may be forwarded for historical completeness.
Communication loss should itself be visible. A missing signal is not the same as a normal process value, and operators need clear indication when their view of a site is incomplete.
🔋 Power Design Determines Sensor Availability
Many remote instruments operate from solar panels, batteries, small generators, or local electrical distribution. Power budgets must account for instrument consumption, communications, heating, charging cycles, and seasonal conditions.
Power constraints can influence sampling frequency and transmission strategy. Sending every raw value continuously may be unnecessary when edge devices can summarize normal behavior and transmit exceptions or selected trends.
Battery health and enclosure temperature deserve monitoring too. An unavailable sensor during a cold period or extended low-sunlight period may be a power-system problem rather than a process problem.
🧩 Edge Computing Keeps Decisions Close to the Asset
Edge computing means processing some data near the well or facility instead of sending every calculation to a distant central server. A local controller can perform filtering, detect a threshold breach, or execute a protective sequence even if communications fail.
This approach can reduce bandwidth demand and response delay. It is especially helpful for time-sensitive control functions, provided the logic is properly tested and managed.
Edge systems still require configuration control. An undocumented local logic change can create confusion when central dashboards and field behavior no longer match.
📈 Analytics Find Patterns People May Miss
Analytics can compare current behavior with historical patterns, identify unusual combinations of variables, estimate equipment condition, and help prioritize investigation. For example, a model may flag a pump whose power, discharge pressure, and vibration relationship has changed gradually.
These tools are best treated as decision support. They may identify a pattern, but they do not automatically establish the physical cause.
Models need representative data and ongoing review. A model trained during one fluid regime, operating strategy, or equipment configuration may perform poorly after conditions change.
🤖 Predictive Maintenance Is Not a Crystal Ball
Predictive maintenance uses condition data to plan intervention before a likely failure. Its practical benefit is often better scheduling: parts, crews, access, and shutdown windows can be arranged with more information.
Predictions carry uncertainty. A machine may fail without a clear precursor, while a suspicious trend may stabilize after an operating change. Maintenance decisions should consider consequence, redundancy, inspection findings, and operating risk.
The strongest programs combine digital condition indicators with experienced technicians who understand the equipment’s actual sounds, loads, maintenance history, and service environment.
⚖️ Production Optimization Needs Operating Constraints
Increasing a well’s rate is not always the best decision. Higher drawdown may increase sand production, accelerate water breakthrough, overload facilities, destabilize artificial lift, or conflict with reservoir-management goals.
Real-time data allow teams to optimize within constraints. An engineer may adjust a choke gradually, observe pressure and rate response, and stop when a defined limit or adverse trend appears.
This is why optimization should be framed as making the best controlled decision, not simply pursuing the largest immediate production number.
🌍 Environmental Monitoring Extends Beyond Compliance
Digital monitoring can help detect abnormal tank levels, pressure losses, flare conditions, pump seal concerns, produced-water handling issues, and equipment states associated with emissions or releases. It can also improve the record available for investigation and maintenance planning.
However, a sensor network does not directly measure every environmental impact. Coverage gaps, detection thresholds, maintenance condition, and local conditions affect what can be observed.
Field inspection remains essential. Cameras, odor reports, visual checks, aerial methods, and direct measurements may each contribute different evidence depending on the operating context.
🔐 Cybersecurity Is an Operational Requirement
Connecting operational technology, or OT, creates pathways for valuable data and remote capabilities. It also introduces cybersecurity risks that differ from those in ordinary office information systems because availability and safe operation are central concerns.
Practical protections include network segmentation, role-based access, secure remote connections, patch management suited to operational constraints, asset inventories, backups, logging, and incident response procedures.
Cybersecurity must be balanced with operability. Security controls that are difficult to use may encourage unsafe workarounds, while uncontrolled convenience can expose critical systems.
👷 The Operator’s Role Becomes More Analytical
Digital monitoring changes work; it does not eliminate the need for capable operators and technicians. People still validate abnormal readings, inspect equipment, understand local conditions, and decide whether an apparent anomaly is meaningful.
Training should cover both process fundamentals and digital literacy. An operator needs to know not only what a trend says, but what could make it wrong: a failed transmitter, a closed impulse line, a communication fault, or an inappropriate alarm configuration.
The best systems respect field knowledge. A concise operator note explaining a valve change or weather event can be as useful in diagnosis as hundreds of unannotated data points.
🗂️ Standardized Tags Make Data Reusable
Tag names, units, equipment identifiers, and status codes may seem administrative, but inconsistent naming makes scaling difficult. If similar wells label the same pressure differently, enterprise analysis becomes slow and error-prone.
Standards should define what each tag represents, its engineering units, source, valid range, sampling behavior, and responsible owner. Metadata is the information that explains the data.
Standardization should not erase useful local context. It should provide a common structure while allowing equipment-specific details to remain visible.
🏗️ Start with a High-Value Use Case
Digital projects often underperform when they begin with a technology purchase rather than an operational problem. A better starting point is a specific question: Which failures cause repeated downtime? Which trips are poorly understood? Which manual checks are risky or time-consuming?
Define the decision that the new data should improve, the measurement required, the expected response, and the method for checking whether the solution works. This turns “collect more data” into an engineering objective.
A pilot should be narrow enough to learn quickly but realistic enough to include field installation, maintenance, communications, workflow, and user adoption.
🪜 A Practical Implementation Sequence
- Map the process, equipment, hazards, and decisions that matter most.
- Identify existing measurements and assess their quality before adding new instruments.
- Select sensors and communications for the actual environment, power supply, and maintenance access.
- Define alarms, displays, ownership, response procedures, and data retention.
- Test installation, signal quality, fail-safe behavior, and cybersecurity controls.
- Review results with operators and engineers, then refine the system before wider rollout.
This sequence may feel slower than deploying devices immediately, but it reduces the risk of creating an expensive collection of unread dashboards.
⚠️ Common Digital Monitoring Mistakes
- Instrumenting everything without a purpose: More tags can create more noise, maintenance burden, and confusion.
- Ignoring field maintainability: A sensor that cannot be safely accessed, cleaned, powered, or calibrated will not deliver lasting value.
- Trusting a single measurement: Cross-checks and process understanding are essential when decisions have high consequences.
- Building dashboards without workflows: Seeing an anomaly is not enough; someone must own the investigation and response.
- Skipping change management: Modified control logic, setpoints, or devices require documentation, testing, and communication.
🔄 Integration Beats Isolated Digital Tools
A standalone vibration platform, production dashboard, maintenance database, and reservoir application can each be useful. Their combined value grows when data and workflows are connected in a controlled, understandable way.
For example, a maintenance alert is easier to prioritize when the planner can see the affected equipment’s production role, operating condition, spare availability, and upcoming shutdown opportunities.
Integration does not mean forcing all information into one screen. It means allowing the right people to move from a signal to relevant context without manually rebuilding the story each time.
📚 Building Trust in Digital Decisions
People adopt monitoring systems when they see that data are reliable, alarms are meaningful, and recommendations fit actual field conditions. Trust is built through small, visible successes and honest treatment of uncertainty.
When a system is wrong, the response should be to investigate the failure mode, correct documentation or logic, and share the lesson. Hiding false alerts damages confidence more than acknowledging and improving them.
Clear roles help: technicians maintain instruments, operators manage the process, engineers interpret performance, and digital specialists support data and system reliability.
🧠 The Core Principle: Better Decisions, Not More Screens
Modern oilfields depend on sensors and digital monitoring because operations must be managed across distance, changing conditions, and interconnected equipment. Timely measurements make deviations visible before they are only visible through lost production, damaged equipment, or a field incident.
But technology is not the objective. The real value comes from a dependable chain: suitable sensors, trustworthy data, resilient communications, useful displays, sensible alarms, clear procedures, and people capable of interpreting the evidence.
When that chain works, a field team can spend less effort searching for basic facts and more effort making informed choices about safety, integrity, production, maintenance, and reservoir performance.
Real-time oilfield monitoring succeeds when it turns changing physical conditions into timely, accountable engineering decisions. The sensor is only the beginning; disciplined operations complete the value. 🛢️📡👷