
Drilling a well thousands of meters into the Earth gives engineers access to rock formations that cannot be seen directly from the surface. But simply drilling a hole does not automatically reveal whether the surrounding rocks contain oil, gas, water, valuable minerals, or nothing commercially useful. 🌍🛢️
To understand what lies underground, geoscientists and petroleum engineers use a collection of techniques known as well logging.
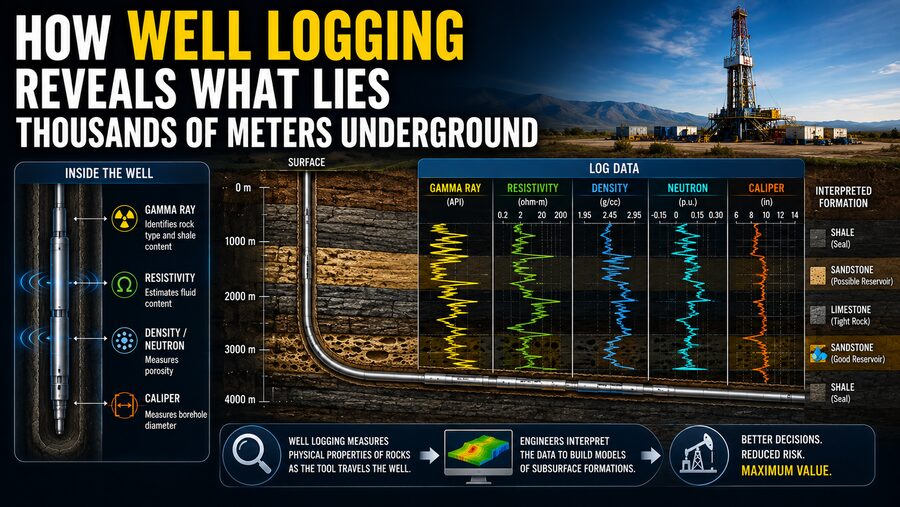
Well logging involves measuring physical properties of the rocks and fluids surrounding a borehole. Specialized instruments are lowered into the well—or built directly into the drilling assembly—and record data continuously as they move through different geological layers.
These measurements can reveal:
- Rock type
- Porosity
- Fluid content
- Formation density
- Electrical resistivity
- Natural radioactivity
- Borehole size
- Rock fractures
- Fluid pressure
- Acoustic properties
The resulting data forms a detailed vertical record of the subsurface, sometimes extending several kilometers below ground.
In simple terms:
Drill a well ➡️ measure the surrounding formations ➡️ interpret the signals ➡️ determine what is underground
Well logging is therefore one of the most important tools in petroleum exploration, groundwater studies, geothermal development, mining, geotechnical engineering, and scientific drilling. 📡🧠
🧭 What Is a Well Log?
A well log is a continuous record of measurements taken along the depth of a borehole.
Instead of producing a photograph of the underground rock, most logging tools measure properties indirectly.
For example, one tool may measure how strongly the surrounding formation resists electrical current. Another may measure natural gamma radiation. Another may send sound waves into the rock and measure how quickly they return.
Each measurement produces a curve plotted against depth.
A typical well-log display might show:
Depth on the vertical axis
and several measurement curves on horizontal tracks.
As the tool moves deeper or shallower through the borehole, the curves change.
Geologists interpret these patterns to determine what type of formation the well has penetrated.
🪨 Why Can Logs Identify Rock Layers?
Different rocks have different physical properties.
For example:
- Shale often contains radioactive clay minerals.
- Clean sandstone may have relatively low natural gamma radiation.
- Limestone has different density and acoustic properties from sandstone.
- Water-filled and hydrocarbon-filled rocks can have different electrical behavior.
Because of these differences, the logging tools create distinctive responses.
A geologist might see a sudden change in several curves and conclude:
“The well has passed from shale into sandstone.”
If that sandstone also shows high porosity and high electrical resistivity, it may contain hydrocarbons.
This is how indirect measurements can reveal geological layers that are otherwise invisible. 🔍
☢️ Gamma Ray Logging
One of the most common tools is the gamma ray log.
Many rocks naturally contain small amounts of radioactive elements such as potassium, uranium, and thorium.
The logging tool measures gamma radiation emitted naturally by the surrounding formations.
Shales commonly contain clay minerals with relatively high concentrations of radioactive elements.
As a result:
High gamma ray reading ➡️ often indicates shale or clay-rich rock
Meanwhile:
Low gamma ray reading ➡️ often suggests cleaner sandstone, limestone, or other low-clay formations
Gamma ray logs are extremely useful for identifying geological boundaries.
They can also help correlate rock layers between different wells.
If two wells several kilometers apart show similar gamma ray patterns at comparable geological positions, geologists may infer that the same rock formation extends between them. 🗺️
⚡ Resistivity Logging
Electrical resistivity logging is especially important when searching for oil and gas.
Resistivity describes how strongly a material opposes the flow of electrical current.
Formation water usually contains dissolved salts, which allow it to conduct electricity relatively well.
Oil and natural gas, in contrast, are poor electrical conductors.
Therefore:
Water-filled rock ➡️ generally lower resistivity
Hydrocarbon-filled rock ➡️ often higher resistivity
However, interpretation is not quite that simple.
Rock type, porosity, water salinity, clay content, and borehole conditions can all affect the measurement.
Engineers therefore combine resistivity logs with other logging measurements before deciding whether a formation contains hydrocarbons.
💧 Why Porosity Matters
Finding oil or gas underground is not enough.
The rock must also contain enough interconnected empty space to store those fluids.
This property is called porosity.
Porosity is the percentage of rock volume occupied by pores or void spaces.
For example, a sandstone with 20% porosity has roughly 20% of its bulk volume occupied by pore space.
Those pores may contain:
- Water 💧
- Oil 🛢️
- Natural gas 🔥
- A combination of fluids
Several well-logging tools can estimate porosity, including density, neutron, and sonic logs.
⚖️ Density Logging
A density log estimates the bulk density of the formation.
The logging tool emits gamma rays into the rock.
These gamma rays interact with electrons in the surrounding material and scatter back toward detectors in the tool.
The amount of scattering depends strongly on electron density, which is closely related to bulk formation density.
Different rocks have characteristic density ranges.
For example, sandstone, limestone, and dolomite commonly have different matrix densities.
If the measured formation density is lower than the density of the solid rock matrix, the difference can indicate the presence of pore space.
Engineers can therefore estimate porosity using density measurements.
Conceptually:
Dense solid rock ➡️ lower porosity
Lower bulk density ➡️ potentially higher porosity
The interpretation must also account for the type of fluid occupying the pores.
⚛️ Neutron Logging
The neutron log also helps estimate porosity, but it works through a different physical principle.
The tool emits high-energy neutrons into the formation.
These neutrons collide with atomic nuclei.
Hydrogen atoms are particularly effective at slowing neutrons because the hydrogen nucleus has nearly the same mass as a neutron.
Since hydrogen is abundant in water and hydrocarbons, the neutron response provides information about the formation’s hydrogen content.
In many rocks:
More hydrogen ➡️ more pore fluid ➡️ potentially higher porosity
For this reason, neutron logs are often treated as porosity indicators.
But they do not directly distinguish between water and hydrocarbons.
That is why they are interpreted together with resistivity and other logs. 🧠
🔊 Sonic Logging
A sonic log, also called an acoustic log, measures how quickly sound waves travel through the formation.
The tool generates an acoustic pulse and records the time required for the wave to travel through the rock between transmitters and receivers.
Dense, well-cemented rocks generally transmit sound differently from porous or fractured rocks.
Sonic measurements can help estimate:
- Porosity
- Rock mechanical properties
- Fracture characteristics
- Seismic velocity
- Formation strength
These data are also useful for connecting well information with seismic surveys.
Seismic surveys measure how sound-like waves travel through large underground regions.
Sonic logs provide precise velocity measurements at the well location, helping geophysicists calibrate seismic interpretations. 🌊📡
🕳️ Caliper Logging Measures the Borehole Itself
Not all logs measure the formation directly.
A caliper log measures the diameter of the borehole.
Ideally, a drilled hole would have a uniform diameter.
In reality, some rock layers can collapse, wash out, fracture, or swell.
A caliper tool detects these changes.
This information matters because borehole geometry can affect other logging measurements.
If a section of the well is much wider than expected, some tools may lose good contact with the rock wall.
That can distort measurements.
Caliper logs also help engineers estimate the amount of cement needed when constructing the well. 🏗️
🎥 Borehole Imaging
Modern well logging can go beyond simple numerical curves.
Borehole imaging tools can create detailed representations of the borehole wall.
Some tools use electrical measurements, while others use acoustic pulses.
These images can reveal:
- Fractures
- Bedding planes
- Faults
- Rock textures
- Breakouts
- Drilling-induced damage
In favorable conditions, the resulting images can resemble a virtual picture of the underground rock surface.
Geologists use these images to determine the orientation of geological layers and fractures.
This is particularly important when evaluating whether fractures could allow oil, gas, geothermal fluids, or groundwater to flow. 📷🪨
🛢️ How Logs Reveal Oil and Gas
No single log normally proves that a formation contains commercially producible hydrocarbons.
Instead, engineers combine several measurements.
Imagine a sandstone interval that shows:
Low gamma ray: suggests relatively clean sandstone
High porosity: indicates significant pore space
High resistivity: suggests the pore fluid may not be conductive water
Neutron-density behavior: may indicate hydrocarbon effects
Together, these signals could suggest an oil- or gas-bearing reservoir.
Interpretation software may then calculate water saturation, which estimates what fraction of the pore space contains water.
The remainder may potentially contain hydrocarbons.
📐 Archie’s Equation and Water Saturation
One classic method used in clean formations is based on Archie’s equation.
The equation relates formation resistivity to porosity and water saturation.
In simplified terms:
Higher resistivity + suitable porosity ➡️ potentially lower water saturation
If the formation contains relatively little conductive water, oil or gas may occupy much of the pore space.
However, Archie’s relationship works best in formations where electrical conduction occurs mainly through the pore water.
Clay-rich rocks can complicate the analysis because clay minerals themselves can contribute to electrical conductivity.
Modern interpretation therefore uses more advanced models when necessary.
🔥 Distinguishing Oil, Gas, and Water
Determining whether a reservoir contains oil, gas, or water often requires combining multiple logs.
Gas can produce distinctive behavior because gas has much lower hydrogen density than liquid water or oil.
For example, neutron and density porosity measurements may separate in characteristic ways in gas-bearing formations.
This is sometimes called a neutron-density crossover effect.
Oil can be more difficult to distinguish from water using porosity logs alone.
Resistivity, fluid sampling, pressure measurements, and other data may be needed.
Well logging therefore works best as a multi-measurement system rather than a single sensor. 📊
🚰 Well Logging Is Also Used for Groundwater
The same techniques are useful far beyond oil and gas.
Hydrogeologists use borehole logs to study underground water.
Logs can help identify:
- Aquifers
- Clay layers
- Fractured rock
- Water-bearing zones
- Salinity changes
- Groundwater flow paths
For example, resistivity may help distinguish fresh water from saline water.
Borehole imaging can reveal fractures that supply groundwater to a well.
Temperature and flow logs can identify depths where water enters or leaves the borehole.
These measurements are important for designing water wells and managing groundwater resources. 💧🌍
🌋 Geothermal Wells
Geothermal projects also rely heavily on well logging.
A geothermal well may reach extremely hot underground formations.
Engineers need to know:
- Temperature
- Pressure
- Rock type
- Fracture networks
- Fluid movement
- Reservoir permeability
Logging tools used in geothermal environments must withstand very high temperatures and pressures.
The data can reveal which fractures carry hot water or steam and help determine whether a geothermal reservoir can produce energy economically. 🌋⚡
🧵 Wireline Logging
One major logging method is wireline logging.
After a section of the well has been drilled, a logging tool is attached to a long armored electrical cable and lowered into the borehole.
The cable provides:
- Mechanical support
- Electrical power
- Data communication
The tool is usually lowered to the desired depth and then pulled upward while recording measurements.
The depth of the tool is tracked carefully.
Wireline logging allows high-quality measurements to be collected with specialized instruments.
However, the borehole must remain stable enough for the tool to travel safely.
🛠️ Logging While Drilling
Another approach is Logging While Drilling, abbreviated as LWD.
In LWD systems, sensors are built directly into the drilling assembly near the drill bit.
Measurements are collected while the well is being drilled.
This provides several advantages.
Engineers can receive formation information soon after the rock is penetrated.
This is especially useful in directional and horizontal wells.
For example, if the drill bit begins leaving a productive reservoir layer, real-time logging information can help the drilling team adjust the well trajectory.
This process is known as geosteering. 🧭🛢️
📡 Measurement While Drilling
A related technology is Measurement While Drilling (MWD).
MWD focuses heavily on drilling and navigation information such as:
- Well inclination
- Direction
- Tool orientation
- Drilling dynamics
LWD more specifically refers to geological and formation measurements.
In practice, MWD and LWD systems often operate together in the same drilling assembly.
Data can be transmitted toward the surface while drilling continues.
One traditional method uses pressure pulses in the drilling fluid, known as mud-pulse telemetry.
The system generates controlled pressure variations that travel upward through the drilling mud.
Surface sensors detect the pulses and decode them into digital information.
It is a remarkable example of sending data from kilometers underground without a conventional communication cable. 📡
🧭 Horizontal Wells Make Logging Even More Valuable
Modern oil and gas wells are not always vertical.
A well may descend several kilometers and then curve until the borehole travels horizontally through a reservoir.
This allows much more of the well to remain in contact with productive rock.
But horizontal drilling requires precise geological guidance.
Logging-while-drilling tools can measure the formation around the drill bit and help determine whether the well remains inside the target layer.
Some advanced tools can even detect geological boundaries before the bit reaches them.
This allows directional drilling teams to steer the well more accurately.
🧪 Formation Testing and Fluid Sampling
Some downhole tools can do more than measure physical properties.
They can directly test reservoir pressure and collect samples of formation fluids.
A formation-testing tool may press a probe against the borehole wall and draw a small amount of fluid from the surrounding rock.
Engineers can then analyze whether the sample contains:
🛢️ Oil
🔥 Gas
💧 Water
Pressure measurements can also show whether different reservoir layers are hydraulically connected.
Fluid samples provide particularly valuable confirmation because they reduce uncertainty from indirect log interpretation.
💨 Porosity Is Not the Same as Permeability
A rock can contain many pores yet still transmit fluids poorly.
This distinction is important.
Porosity measures how much empty space exists.
Permeability measures how easily fluids can move through the connected pore network.
Imagine two sponges.
Both may contain the same amount of empty space, but one might have well-connected pores while the other has isolated cavities.
The first allows water to flow much more easily.
Logs can provide clues about permeability, but direct formation tests, core measurements, and production data may also be needed.
🪨 Core Samples Complement Logging
Well logging is often combined with coring.
Instead of grinding all the rock into drill cuttings, a special drilling tool can recover a cylindrical section of formation called a core.
Scientists can examine this physical rock sample in a laboratory.
They can measure:
- Porosity
- Permeability
- Mineral composition
- Grain size
- Mechanical strength
- Fluid saturation
Core data helps calibrate and verify interpretations from well logs.
However, coring is slower and more expensive than logging every meter of a well.
That is why logs provide continuous coverage while cores are usually collected from selected intervals.
🧠 Computers Turn Logs Into Geological Models
Modern well logging produces enormous amounts of digital data.
Interpretation software combines measurements to estimate properties such as:
- Shale volume
- Effective porosity
- Water saturation
- Hydrocarbon saturation
- Mineral composition
- Formation pressure
- Rock mechanical strength
Engineers may also combine logs from many wells to build a three-dimensional reservoir model.
The model helps answer questions such as:
Where does the reservoir begin and end?
Which areas contain the best-quality rock?
How much oil or gas might be present?
Where should the next well be drilled?
This turns individual borehole measurements into a much larger picture of the underground geology. 🗺️💻
⚠️ Well Logging Has Limitations
Logging tools are extraordinarily useful, but their measurements require careful interpretation.
Results can be affected by:
- Drilling mud
- Borehole diameter
- Tool position
- Temperature
- Pressure
- Rock mineralogy
- Salinity
- Clay content
- Invasion of drilling fluid into the formation
For example, drilling fluid can penetrate porous rock around the borehole and change its electrical properties.
This means the tool may measure a zone that has been altered slightly by drilling rather than completely undisturbed reservoir rock.
Petrophysicists account for these effects using corrections and mathematical models.
👩🔬 The Role of the Petrophysicist
The specialist who interprets many of these measurements is called a petrophysicist.
Petrophysics examines the physical and chemical properties of rocks and their interactions with fluids.
A petrophysicist combines:
- Well logs
- Core data
- Geological information
- Fluid samples
- Pressure measurements
- Seismic data
The objective is to determine the properties of the subsurface as accurately as possible.
This work is critical because drilling a deep well can cost millions of dollars.
Decisions about completing, producing, testing, or abandoning a well may depend heavily on log interpretation. 💰
🌍 A Kilometer-Deep Scientific Measurement System
What makes well logging remarkable is the environment in which the instruments operate.
A logging tool may work:
- Thousands of meters underground
- Under enormous pressure
- At elevated temperatures
- Inside corrosive fluids
- In a borehole only a few centimeters wider than the tool
Despite these conditions, the instruments must make precise measurements of radiation, electrical fields, acoustic waves, pressure, and mechanical geometry.
Modern downhole electronics are therefore engineered to survive extreme environments while transmitting reliable scientific data.
🏁 Conclusion
Well logging allows engineers and geoscientists to investigate underground formations without needing to physically excavate kilometers of rock. 🌍🔍
Specialized tools measure how the surrounding formations respond to radiation, electricity, sound, neutrons, pressure, and other physical processes.
A gamma ray log can help distinguish shale from cleaner formations.
A resistivity log can help determine whether pore spaces contain conductive water or less conductive hydrocarbons.
Density, neutron, and sonic logs provide clues about porosity.
Borehole images reveal fractures and geological structures.
Formation-testing tools can measure pressure and even recover underground fluid samples.
When these measurements are combined, the result is a detailed vertical profile of the Earth.
What begins as a narrow hole drilled into the ground becomes a sophisticated scientific observatory extending thousands of meters beneath the surface. 🛢️📡🧠
Well logging turns invisible geology into measurable data—and that data helps people find energy resources, manage groundwater, develop geothermal reservoirs, understand rock formations, and make safer, more informed decisions about what lies deep beneath our feet.