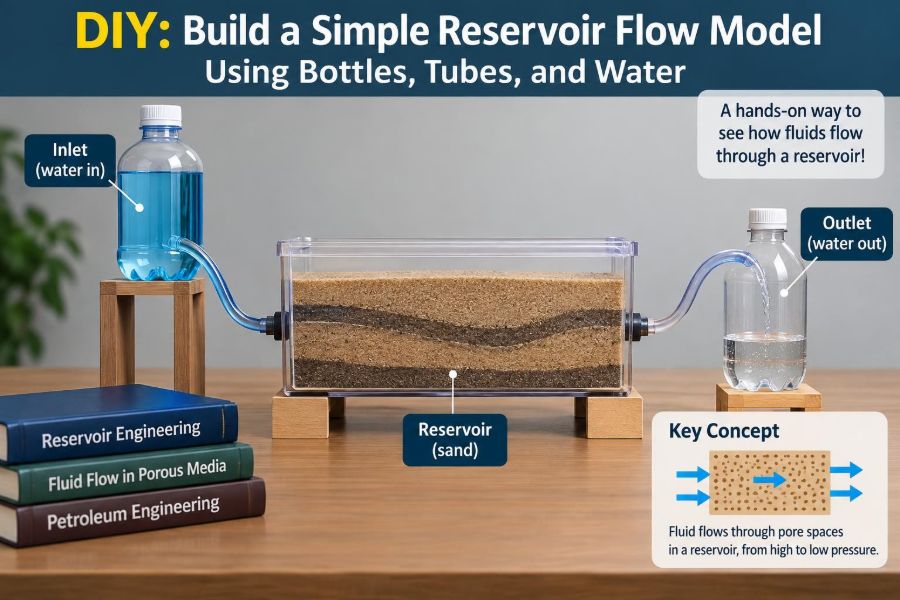

A reservoir can seem impossibly remote: thousands of metres below ground, hidden behind steel casing, rock layers, pressure data, and simulation software. Yet some of its most useful flow ideas can be observed on a bench with water bottles, tubing, and a measuring cup.
Imagine opening a small clamp on a tube and watching water begin to leave a bottle. The flow starts strongly, then slows. Raise one bottle, lower another, pinch the tube, or seal the cap, and the response changes immediately. Those visible changes are a compact introduction to the same pressure-and-resistance thinking used in petroleum engineering.
This is not a miniature oil field, and it should not be treated as a quantitative prediction tool. It is a transparent physical analogy: a way to connect pressure, flow rate, permeability, hydrostatic head, and production constraints before the equations become abstract.
With careful observations, a simple model can turn familiar household materials into a useful laboratory exercise for students, trainees, and professionals refreshing the fundamentals.
🧭 What This Model Is Designed to Teach
The basic setup represents fluid moving from a higher-energy region to a lower-energy region through a resistance. In reservoir terms, one bottle acts as a simplified source or reservoir, tubing represents a flow path, and the receiving bottle or measuring cup represents production.
Its central lesson is direct: fluid flows because of an energy difference, but the rate is limited by resistance. In a reservoir, that energy difference is commonly expressed as a pressure difference. Resistance comes from rock permeability, fluid viscosity, well completion restrictions, and surface equipment.
Water is used because it is safe, visible, and convenient. It does not reproduce all oil-and-gas behaviour, but it makes the essential cause-and-effect relationship easy to see.
🧪 What the Household Analogy Represents
A good analogue preserves one mechanism while admitting what it leaves out. Here, the source bottle contains a connected volume of water, much like a reservoir contains a connected fluid phase in pore spaces. A tube provides a controlled pathway, much like flow through rock and into a well.
The outlet is the production point. Water collected over a known time is analogous to a production rate. If you introduce a restriction, you are creating a simple version of pressure loss near a well or through production hardware.
Do not interpret the bottle as a literal rock sample. Most of its volume is open water, whereas reservoir fluids occupy tiny interconnected pores. The model teaches flow-system logic, not reservoir-scale geometry.
🧰 Gather Simple, Safe Materials
Choose transparent materials so the system is easy to inspect. Two sturdy plastic bottles with caps, flexible clear tubing, a clamp or pinch valve, water, food colouring, tape, a ruler, a timer, and a measuring jug are enough for a first run.
- One source bottle, ideally 1–2 litres
- One receiving bottle or graduated measuring container
- Flexible tubing that fits securely through bottle caps
- A clamp, binder clip with padding, or small valve
- Water and optional food colouring
- A tray or basin to contain spills
- Marker pen, ruler, timer, and notebook
If the tubing must pass through a cap, an adult should make the hole using appropriate tools. The fit must be snug; loose connections cause leaks and air entry that can confuse the experiment.
🛡️ Set Sensible Safety Boundaries
Keep this model low pressure. Do not use compressed air, sealed pressure vessels, glass bottles, fuels, solvents, or hot water. A squeezed or tightly sealed bottle can unexpectedly eject tubing or spray water if a connection fails.
Work over a tray and keep electrical devices away from spills. If a cap or tube seems loose, stop the test, release any trapped pressure by opening the system carefully, and rebuild the connection.
The safest design relies on gravity and modest water-column height. That is more than adequate for demonstrating the concepts in this article.
🏗️ Build the Basic Gravity-Flow System
Make a small hole in each cap, insert the tubing, and seal around it only if necessary to prevent leaks. Position the source bottle on a stable support above the receiving bottle. The tube should run from near the bottom of the source bottle to the receiver.
Leave the source bottle cap arrangement able to admit air, either through a tiny vent hole or by not sealing it completely. Fill the source bottle with coloured water, close the clamp, and confirm that the entire system is steady before opening the line.
- Mark the starting water level on the source bottle.
- Place the receiver in a tray and set the timer ready.
- Open the clamp and observe the first 30–60 seconds.
- Measure collected volume, then repeat for equal time intervals.
- Record the water level in the source bottle after each interval.
Secure the tube with tape so its outlet does not jump out of the receiving container.
🌬️ Why the Source Bottle Needs a Vent
As water leaves a vented source bottle, air replaces the departing volume. Without that replacement, pressure above the water falls below atmospheric pressure, opposing further outflow.
Try the comparison deliberately. Run the system with a vent, then block it after flow has begun. You may see the water slow dramatically, pulse, or stop. This illustrates that flow depends on the pressure condition at both ends of the system, not merely on how much liquid is present.
In field operations, reservoirs are not normally “vented” like a bottle. Their pressure support comes from fluid expansion, connected aquifers, gas caps, or injected fluids. The analogy is the need for a mechanism that sustains driving energy.
📏 Read Pressure from Water Height
In this gravity arrangement, the source water level sits above the outlet. That vertical separation creates a hydrostatic pressure difference. The greater the height difference, the larger the force per unit area available to move the water.
For an incompressible liquid, hydrostatic pressure change is often written as ΔP = ρgΔh, where ρ is density, g is gravitational acceleration, and Δh is elevation difference.
You do not need to calculate a precise value for the model to be instructive. Simply recognize that lowering the source water level reduces Δh, so the flow-driving pressure declines as the test continues.
➡️ See the Pressure-Difference Rule in Action
For a fixed flow path, opening the clamp creates flow because the pressure at the source end exceeds pressure at the outlet. As the water level falls, the driving difference shrinks and the observed rate should tend to decline.
That behavior is analogous to production from a reservoir with declining average pressure, although real production trends can also reflect changing fluid properties, gas liberation, water influx, operational constraints, and well controls.
A useful habit is to ask two questions whenever rate changes: Did the driving pressure change, or did the resistance change? The bottle model lets you alter each separately.
🪨 Make Permeability Visible with Tube Resistance
Permeability is a rock property describing how readily connected pores transmit fluid. You cannot create rock permeability exactly with open tubing, but tube diameter and length make a useful resistance analogue.
Use a narrower tube, a longer tube, or two tubes in series. At the same water height, the flow rate will be lower than with a short, wide tube. The source still has driving energy, but the pathway dissipates more of it.
This mirrors a key reservoir distinction: a large volume of fluid does not guarantee an economical rate. Fluid must have a sufficiently transmissive route to the well.
🧱 Model Near-Wellbore Restrictions
A sharp kink, partially closed clamp, cotton plug designed not to shed fibres, or short narrow section can represent an added restriction. In petroleum language, this resembles a simplified skin effect: extra pressure loss close to the wellbore.
With the restriction installed, collect water for the same timed interval as your baseline. If the source height is the same, a lower collected volume indicates that more of the available pressure is being consumed by the added resistance.
The analogy has limits. Actual skin may arise from formation damage, completion geometry, partial penetration, or stimulation effects. A clamp does not identify the cause; it only makes the consequence—additional pressure drop—visible.
🛢️ Connect the Setup to Darcy’s Law
Single-phase flow through porous rock is commonly introduced with Darcy’s law. In simplified form, flow rate rises with pressure difference and permeability, and falls with fluid viscosity and flow distance.
A representative one-dimensional expression is q = (kA/μL)ΔP. Here q is flow rate, k permeability, A flow area, μ viscosity, L flow length, and ΔP pressure difference.
Your tube experiment is not a direct Darcy-law measurement because flow in an open tube follows different geometry and physics. Still, the directional lessons are aligned: more driving force tends to increase rate; more resistance tends to decrease it.
🧴 Explore Viscosity Without Overclaiming
Viscosity is a fluid’s internal resistance to flow. Water flows readily, while a thicker liquid, such as a diluted syrup solution, generally moves more slowly through the same tube under the same height difference.
If you run this comparison, clean tubing thoroughly afterward and do not pour thick mixtures into drains in large amounts. Use small volumes and dispose of them responsibly according to local practice.
Keep the interpretation narrow. Thick household liquids are not crude-oil analogues in a rigorous sense, and they can have non-Newtonian behavior. They are useful only for showing why a more viscous fluid needs more pressure to achieve a similar rate.
📉 Watch a Simple Decline Curve Develop
Record the collected volume every 30 seconds or every minute, then calculate interval rate as volume divided by time. Early intervals will often produce more water than later intervals because the water level, and therefore gravity head, is falling.
A plot of rate versus time creates a simple decline trend. The shape will not match a specific reservoir decline model unless the system has been deliberately designed and characterized. It is best viewed as an observation of fading driving force.
For a cleaner run, start each experiment with the same initial fill level, tube arrangement, and outlet elevation.
🧮 Turn Observations into Useful Data
Good experimental work begins by separating what you see from what you infer. Record the raw measurements first: time, collected volume, source water level, tube configuration, and any restriction setting.
| Time interval | Collected volume | Interval rate | Source level | Observation |
|---|---|---|---|---|
| 0–60 s | Measure | Volume ÷ 60 s | Mark or measure | Steady, pulsing, leaking? |
| 60–120 s | Measure | Volume ÷ 60 s | Mark or measure | Any change in flow? |
| 120–180 s | Measure | Volume ÷ 60 s | Mark or measure | Air bubbles or restriction? |
Repeating each configuration is worthwhile. Small differences in tube placement, water temperature, or starting level can alter results enough to hide the effect you intended to test.
🔄 Compare Constant-Head and Falling-Head Flow
In the basic single-bottle test, the water level falls: this is a falling-head experiment. The changing head means the pressure difference is not constant, so flow rate naturally changes over time.
You can approximate constant-head flow by keeping the source water level close to a marked line, adding water gently as it drains. Another option is to use a large source reservoir relative to the collected test volume.
Constant head is useful when comparing tube restrictions because it holds the main driving force approximately steady. Falling head is useful when learning about depletion-like behavior.
💧 Add a Second Bottle for Pressure Support
Place a second, higher bottle upstream of the source bottle and connect it so it can slowly feed water into the source. The second bottle becomes a crude pressure-support analogue, helping maintain the source water level while production continues.
Adjust the inlet so the source does not overflow. If inflow roughly matches outflow, the source level changes more slowly and the production rate may remain steadier for longer.
This resembles the purpose, not the exact mechanics, of water influx or water injection: supplying fluid to help maintain pressure and displace producible fluid toward an outlet.
🌊 Distinguish Water Drive from Water Production
Support water is not automatically bad. In many reservoirs, aquifer support or injected water can provide valuable energy and improve displacement. The complication is that water may eventually reach the producing well in increasing quantities.
To visualize this, add a separate dyed-water feed upstream. When the dyed water begins to appear at the outlet, it represents a simplified breakthrough event. The color change is easy to observe, but it does not reproduce the complex displacement fronts of porous rock.
In the field, water production affects lifting, separation, corrosion management, disposal, and economics. The bottle model shows only the basic connectivity question: where does injected or supporting water travel?
🎨 Use Dye to Trace Flow Paths
Food colouring makes flow paths easier to interpret. Inject a small coloured slug near the source-tube entrance and time how long it takes to emerge. Repeat after changing tube length, routing, or restrictions.
This is a simple residence-time demonstration. A rapid dye arrival suggests a short, fast pathway in the model; delayed arrival suggests more storage volume or greater resistance.
Do not conclude that one dye transit time gives reservoir permeability or sweep efficiency. Reservoir tracers move through irregular three-dimensional pore networks and can interact with phases and rock surfaces. Use the dye only as a visual diagnostic.
🫧 Introduce a Gas Cap Analogy Carefully
Leave some air space at the top of a source bottle and seal it, then gently compress the flexible bottle before opening the outlet. The compressed air can push water out, demonstrating that gas pressure can provide driving energy.
Use only slight manual compression and avoid rigid containers. As water leaves, the gas expands and its pressure falls, so the support declines unless more energy is supplied.
This is a conceptual analogue for gas expansion, not a representation of real gas-cap drive. Real reservoir gas behavior involves compressibility, phase equilibrium, changing composition, and pressure-temperature effects that a bottle cannot capture.
⚖️ Separate Hydrostatic Head from Applied Pressure
Gravity head comes from elevation difference. Applied pressure comes from squeezing a flexible bottle or adding a carefully controlled, low-pressure source. Both can create a pressure difference, but they are not interchangeable experimental conditions.
Keep them separate during basic tests. First compare different heights with the bottle vented. Then, if you conduct a gentle sealed-bottle demonstration, label it as an applied-pressure case.
This discipline matters in engineering calculations too. Elevation, reservoir pressure, frictional loss, and equipment pressure changes all contribute to the total pressure balance, but each has a different origin.
📍 Understand Where Pressure Is Lost
Pressure is not simply “used up” at one location. In a flowing system, pressure changes along the path. Some change arises from elevation, some from friction and restrictions, and some from acceleration effects that are usually small in a slow bench-top setup.
Install short transparent segments before and after a restriction if possible. While you cannot directly see pressure, you can compare the resulting rate at the same source level. The restriction is where more of the available driving force is dissipated.
In wells, engineers distinguish reservoir pressure, flowing bottomhole pressure, tubing pressure, and surface pressure because each location helps diagnose a different part of the system.
🧭 Treat the Outlet as a Simple Well Control
The clamp at the outlet functions like a very simplified choke. Closing it partway increases resistance and reduces the produced rate. Opening it increases rate if enough driving pressure remains.
A larger opening is not always automatically the best operating choice in real wells. Excessive drawdown can contribute to sand production, coning, unstable flow, equipment limits, or unwanted gas and water production, depending on the reservoir and completion.
Your model cannot reproduce those risks, but it reinforces the operational principle: rate control changes the pressure distribution throughout the flowing system.
🧱 Add a Porous-Media Extension
For a closer visual connection to pore-scale flow, fill a clear plastic bottle or transparent tube with clean, uniform aquarium gravel or coarse sand, retaining the material with mesh at each end. Saturate it slowly with water and connect it between the source and receiver.
Compared with open tubing, flow through the packed section should be slower because water must navigate small passages between grains. Avoid very fine sand unless you have reliable containment; it can clog tubing and create messy, inconsistent tests.
This extension better suggests porosity and permeability, but it also introduces variability. Packing density, grain size, trapped air, and channeling can change between runs.
🕳️ Porosity Is Not the Same as Permeability
Porosity is the fraction of a material’s bulk volume occupied by void space. Permeability describes the ability of those void spaces to connect and transmit fluid. A material can hold fluid yet transmit it poorly if its pore throats are small or poorly connected.
In the packed-bottle extension, two media can appear to contain similar water volume but drain at very different rates. Coarse, well-connected gravel generally transmits water more readily than tightly packed fine material.
This distinction is fundamental in reservoir characterization. Storage capacity and deliverability are related, but they are not the same property.
🚫 Common Setup Mistakes and Their Consequences
Most confusing results come from simple experimental issues rather than surprising physics. Diagnose the apparatus before making reservoir interpretations.
- No source vent: flow slows or stops because a partial vacuum develops.
- Air bubbles in tubing: flow can pulse, and volume readings become less consistent.
- Changing starting level: tests have different driving pressure from the outset.
- Leaking caps: measured production no longer equals source outflow.
- Kinked tubing: an unintended restriction overwhelms the variable being tested.
- Different timing windows: rate comparisons become unreliable in falling-head tests.
Photographing each configuration before a run is a practical way to preserve the details you may otherwise forget.
🔍 Design One-Variable Experiments
Change one factor at a time. For example, hold source height and fluid type constant while comparing a short tube to a long tube. Then return to the baseline before changing another variable.
A simple test sequence might include baseline flow, reduced outlet opening, longer tubing, increased source elevation, and packed-media insertion. Each run should have the same initial volume and measurement period where feasible.
When several changes are made together, the result may be interesting but difficult to explain. Controlled comparisons are how a demonstration becomes an experiment.
📊 Interpret Results Without Pretending They Are Field Data
Use careful language in notes and presentations. Say that a narrower tube increased flow resistance in the model, rather than claiming it measured a reservoir permeability reduction. Say that a falling water level illustrated declining driving head, rather than declaring it reproduced a reservoir’s depletion history.
Scale is the major limitation. Reservoir flow involves vast distances, complex boundaries, heterogeneous rock, multiple phases, compressibility, gravity segregation, temperature effects, and well geometry. A bench model isolates selected mechanisms by intentionally leaving most of that complexity out.
That limitation is a strength when stated honestly. It lets learners focus on a clear relationship before moving to core analysis, well testing, material balance, or numerical simulation.
🧠 Connect the Demonstration to Reservoir Equations
Once the visual ideas are established, equations become easier to interpret. Pressure drawdown is the difference between a reference reservoir pressure and flowing pressure near the well. Greater drawdown can raise rate, provided the reservoir and completion can transmit fluid.
Material balance tracks fluids and pressure in a reservoir system. Relative permeability describes how the presence of oil, water, or gas changes each phase’s ability to flow. Productivity index relates well rate to pressure drawdown under specified conditions.
The bottle model does not calculate these quantities reliably. Its value is conceptual: it gives physical meaning to terms such as driving force, flow resistance, pressure support, and restriction.
📝 A Compact Lab-Report Format
A short report makes this exercise more valuable than a casual demonstration. State the question first, such as: “How does outlet restriction affect water rate at approximately constant head?” Then describe the apparatus so another learner could reproduce it.
Include a sketch, starting conditions, a data table, and one plot. In the discussion, distinguish observations from interpretation and list limitations directly.
- Observation: a partially closed clamp produced less collected volume in 60 seconds.
- Interpretation: the clamp increased resistance and reduced rate at similar driving head.
- Limitation: open-tube flow is not the same as multiphase flow through porous reservoir rock.
This structure mirrors professional engineering communication: transparent assumptions make conclusions more useful.
🧑🏫 Use It in Teams or Training Sessions
For a group exercise, assign roles: one person operates the valve, one times, one reads volume, one records conditions, and one challenges assumptions. Rotate roles on the next configuration.
Ask teams to predict results before opening the clamp. Will a higher bottle increase the initial rate? Will a longer tube alter rate at the same head? What happens if the source is not vented? Prediction turns observation into active learning.
For experienced professionals, the model is a fast way to discuss nodal thinking: a production rate emerges from the interaction of reservoir inflow, near-wellbore effects, tubing losses, and surface backpressure.
🌍 Know When to Move Beyond the Bottle
Use this model for intuition, introductory instruction, and qualitative comparison. Move to laboratory core floods when pore geometry, saturation, displacement, and rock-fluid interaction matter. Move to analytical methods or reservoir simulators when boundary conditions, compressibility, wells, heterogeneity, and forecast scenarios must be evaluated.
No single method replaces the others. A physical analogy can make a simulation result easier to question, while a calibrated simulation can reveal effects the bottle cannot display.
The engineering skill is knowing which level of model is adequate for the decision at hand.
✅ The Core Lesson: Flow Needs Drive and a Path
This small experiment gathers several reservoir-flow fundamentals in one visible system. Water moves when there is a pressure difference. Its rate changes when that difference changes or when the flow path becomes more or less resistant.
Height in the bottle provides a gravity-driven pressure analogue. Narrow tubing and clamps represent added resistance. A second feed bottle represents pressure support in principle. Dye reveals travel paths, while a packed section introduces the idea that storage space and transmissive capacity are different.
The most useful takeaway is not a particular measured rate. It is the habit of tracing every flow response back to driving force, pathway resistance, boundary conditions, and experimental assumptions.
A pair of bottles cannot predict a reservoir, but it can make reservoir flow reasoning tangible: pressure creates the opportunity to flow, and the connected path determines how readily that opportunity becomes production. Keep observing, questioning, and testing one variable at a time. 🛢️💧📈