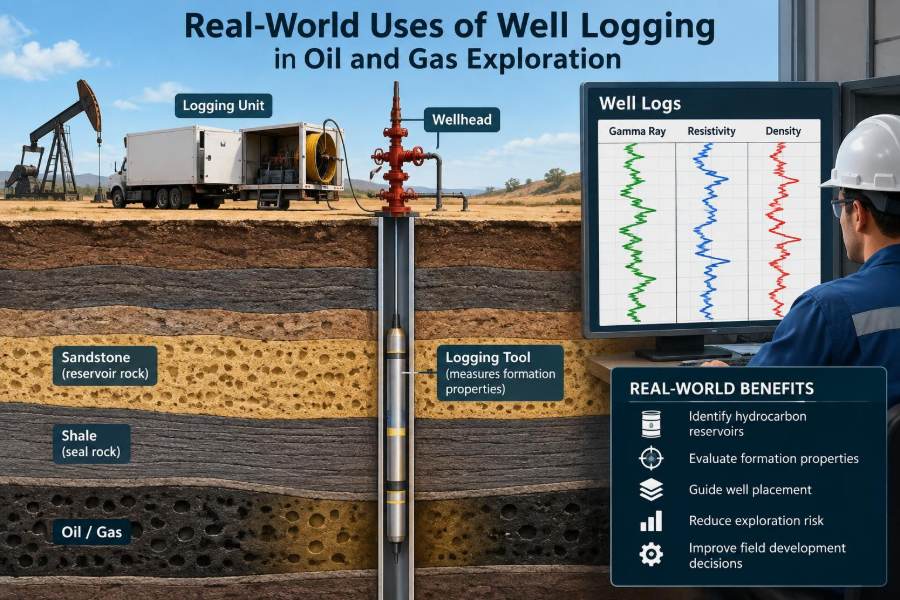

A drilling crew may have spent days reaching a target depth, yet the most consequential question is still unresolved: did the bit enter a reservoir that can actually produce hydrocarbons? Cuttings at the surface offer clues, but they are mixed, delayed, and incomplete. The answer must come from measurements made along the borehole wall.
That is where well logging becomes a practical decision tool rather than a textbook topic. A log can help a geologist distinguish shale from sand, help a petrophysicist estimate fluids in pore space, and help an operations team decide whether to run casing, test an interval, or move on.
In a mature field, the same measurements can reveal why one well watered out early while a nearby well still performs well. In a high-cost offshore well, logs may influence decisions worth far more than the cost of acquiring them.
Well logs do not provide a direct photograph of oil and gas underground. They are physical responses that must be interpreted with geology, drilling conditions, cores, pressures, and production evidence. Their real-world value lies in reducing uncertainty at the moments when a decision cannot wait.
🧭 What Well Logging Actually Measures
Well logging is the recording of rock and fluid properties versus depth in a borehole. Tools measure signals such as natural radioactivity, electrical resistivity, acoustic travel time, density, neutron response, borehole diameter, pressure, and fluid samples.
A log is therefore not a single answer. It is a continuous depth-based record that lets interpreters connect changes in measurements to changes in lithology, porosity, fluid type, and formation condition.
🕳️ Why the Borehole Needs More Than Drill Cuttings
Drill cuttings are useful but can be contaminated by cavings from higher formations, mixed while traveling upward, and altered by drilling. Cores provide direct rock samples but are costly and cover only selected intervals.
Logs fill the gaps. They measure nearly the full open-hole section and can identify thin beds or subtle transitions that may be missed in cuttings. Their strength is coverage, consistency, and speed—not perfect certainty.
📏 The Depth Reference Behind Every Decision
A productive-looking interval is useless if its depth is wrong. Wireline depth, logging-while-drilling depth, and drillers’ depth may differ because of cable stretch, pipe movement, tool position, and reference choices.
Teams correlate recognizable log markers, such as distinctive shale beds, to place curves on a common depth datum. Poor depth matching can cause perforations to miss the intended sand or make two wells appear geologically inconsistent when they are not.
☢️ Gamma Ray for Separating Shale and Cleaner Beds
The gamma ray log records natural radioactivity. Many shales produce relatively high readings because they commonly contain radioactive potassium-bearing clay minerals, while cleaner sands and carbonates often read lower.
The word often matters. Some sands contain radioactive minerals, and some carbonate or shale intervals behave unexpectedly. Gamma ray is best used as a lithology indicator alongside other logs, not as a universal reservoir detector.
⚡ Resistivity for Recognizing Hydrocarbon Charge
Resistivity logs measure how strongly a formation resists electrical current. Brine generally conducts electricity more readily than hydrocarbons, so a porous rock containing hydrocarbon can show higher resistivity than the same rock filled with saline water.
High resistivity alone is not proof of oil or gas. Tight rock, fresh formation water, invasion effects, and certain minerals can also produce elevated readings. The useful question is whether resistivity agrees with porosity, lithology, and known water properties.
🪨 Density Logs and the Rock Framework
A density tool uses a radioactive source and detectors to estimate bulk density, which reflects the combined effect of rock matrix, pore space, and pore fluids. In a clean sandstone of known mineral composition, lower bulk density commonly suggests higher porosity.
Density also helps identify lithology. Limestone, dolomite, sandstone, coal, and shale tend to occupy different response ranges, though mixtures and poor borehole conditions complicate the picture.
🧪 Neutron Logs and Hydrogen in Pores
Neutron tools respond mainly to hydrogen, which is abundant in formation water and oil. In many liquid-filled reservoirs, their response can be converted into an estimate called neutron porosity.
Gas contains less hydrogen per unit volume than liquid, so a gas-bearing interval can produce a distinctive separation between density and neutron curves. That separation is a valuable clue, but shale-bound water and unusual lithology can imitate or distort it.
🔊 Sonic Logs for Porosity and Mechanical Behavior
Sonic logs measure the travel time of acoustic waves through formation. Sound generally travels more slowly through porous rock than through dense, well-cemented rock, allowing sonic data to support porosity estimation.
Beyond reservoir evaluation, sonic measurements are central to well design. They help estimate elastic properties, detect changes in rock stiffness, support geomechanical models, and provide inputs for seismic-to-well calibration.
📐 The Density-Neutron Crosscheck
Interpreters commonly compare density and neutron curves because each responds differently to rock and fluids. When both indicate appreciable porosity in a relatively clean interval, confidence in a reservoir-quality zone increases.
A pronounced density-neutron separation may indicate gas, but it can also arise from lithology effects or bad hole conditions. This is a classic example of why logs should be interpreted as a pattern rather than read one curve at a time.
🧱 Estimating Lithology Before Calculating Fluids
Water saturation calculations require assumptions about the rock matrix and clay content. Treating a shaly sandstone as clean sandstone can overstate hydrocarbon saturation; treating a carbonate mixture as pure limestone can distort porosity.
Practical interpretation begins with a lithology model: sandstone, limestone, dolomite, shale, coal, evaporite, or a mixture. Gamma ray, density, neutron, sonic, photoelectric response, cuttings, and core all contribute evidence.
💧 Turning Porosity Into a Reservoir Question
Porosity is the fraction of rock volume occupied by pores. It is necessary for storage, but not sufficient for commercial production. Pores must be connected, and fluids must be able to move through them.
Logs estimate total porosity, while the effective porosity available for movable fluids may be lower in clay-rich formations. A high-porosity shale can contain substantial water yet remain a poor conventional reservoir.
🧂 Estimating Water Saturation Carefully
Water saturation is the proportion of pore volume occupied by water. It is commonly inferred by combining resistivity, porosity, and an estimate of formation-water resistivity through an appropriate petrophysical model.
The result depends strongly on assumptions. Salinity can vary, clay conductivity can matter, and invasion by drilling filtrate can alter the near-borehole response. A saturation value is therefore an estimate with a range of confidence, not an absolute fact.
🛢️ Identifying Pay Is More Than Finding Oil
Net pay is the interval judged capable of contributing economically under a defined development plan. It usually depends on cutoffs for thickness, porosity, water saturation, permeability indicators, and sometimes clay volume or mechanical quality.
These cutoffs are not fixed laws. A thin, lower-quality zone might be worth completing near existing infrastructure, while the same zone may not justify a new remote well. Economic context changes the operational meaning of a log.
🔍 Recognizing Thin Beds and Hidden Layers
Reservoirs are often layered at scales smaller than a logging tool’s vertical resolution. A thin clean sand between shales may appear as a muted average response rather than a textbook curve shape.
High-resolution tools, image logs, core, and careful correlation can recover some of this detail. Ignoring thin beds may underestimate pay; overinterpreting noisy thin-bed responses can create pay that does not exist.
🧷 Borehole Images for Fractures and Bedding
Electrical and acoustic image logs create an oriented picture of the borehole wall. They can reveal bedding dip, natural fractures, faults, breakouts, drilling-induced fractures, vugs, and structural features that conventional curves cannot resolve.
In fractured carbonate reservoirs, this information can change completion strategy. A fracture may improve productivity, but it can also connect to unwanted water or create uneven flow between zones.
🧯 Caliper Logs and the Reality of Hole Conditions
A caliper log measures borehole diameter. Washouts occur where weak formations enlarge; mudcake can narrow the apparent hole; ledges and rugosity create irregular contact between tools and the formation.
These conditions affect density, neutron, and other pad-contact measurements. Before trusting an attractive reservoir response, an interpreter checks whether the tool was measuring formation properly or responding to a damaged borehole.
🚧 Logging-While-Drilling for Faster Choices
Logging-while-drilling (LWD) tools acquire data close to the bit while drilling continues. The information can reach the surface quickly enough to guide geosteering, casing decisions, and changes in mud or drilling parameters.
LWD may be especially valuable in long horizontal sections, where staying inside a narrow reservoir window is difficult. Its limitations include telemetry constraints, tool placement behind the bit, and data quality affected by drilling dynamics.
🧵 Geosteering Through a Thin Reservoir Window
In a horizontal well, the target may be only a few metres thick and bounded by water-bearing rock below or non-reservoir shale above. Real-time gamma ray, resistivity, inclination, and azimuth measurements help the team infer where the bit is relative to those boundaries.
A hypothetical example is a horizontal well that sees rising gamma ray and falling resistivity near the roof. The geosteering team may adjust trajectory downward—but only after checking structural dip, tool offsets, and whether the signature reflects shale rather than drilling effects.
🧭 Correlating Wells Across a Field
Logs provide a common language between wells. A distinctive shale, tight carbonate, or flooding surface can be traced from one borehole to another, helping geoscientists build structural and stratigraphic models.
Correlation is not simply matching similar-looking curves. Faulting, lateral facies changes, erosion, and variable bed thickness can make a direct match misleading. The best correlations integrate seismic interpretation, cores, biostratigraphy where available, and regional geology.
📊 Calibrating Seismic With Well Data
Seismic data shows reflections in time, whereas wells measure depth. Sonic and density logs can be combined to create a synthetic seismic trace, allowing interpreters to tie known formations to seismic reflectors.
This bridge helps extend well-scale knowledge away from the borehole. It also exposes uncertainty: an incorrect time-depth relationship or poor log quality can shift a horizon and affect volume estimates or well placement.
🧱 Designing Casing and Cement Programs
Logs support well construction as well as reservoir evaluation. Caliper data identifies washout-prone intervals that may require additional cement volume, while sonic and density data support geomechanical assessment and casing design.
After cementing, cement evaluation logs can help assess the quality of bonding behind casing. They do not replace pressure testing or operational judgment, but they can identify intervals needing closer investigation before completion.
🎯 Choosing Perforation Intervals
Perforating connects the cased wellbore to selected reservoir layers. Logs help engineers avoid perforating water-bearing zones, low-quality rock, shale streaks, or intervals isolated by barriers that would add little production.
Selection should integrate net-pay interpretation with pressure data, fluid contacts, completion hardware, reservoir simulation, and offset-well performance. The highest resistivity interval is not automatically the best perforation target if it is tight or poorly connected.
🌊 Diagnosing Water and Gas Breakthrough
Production logging tools measure flow contributions inside a producing well. Temperature, noise, spinner, density, and holdup measurements can help identify where water or gas enters the wellbore.
This matters when total production changes but the cause is unclear. A water increase may reflect a perforated water zone, channeling behind pipe, coning from below, or crossflow. The remedy differs for each mechanism.
🔄 Monitoring Depletion and Remaining Potential
Repeat logging can compare current conditions with earlier measurements. Pulsed-neutron logs, for example, may be used through casing to monitor changes in fluid saturation under suitable conditions.
Time-lapse interpretation is challenging because tool type, depth alignment, completion changes, and reservoir conditions must be comparable. Still, it can help prioritize workovers, identify bypassed pay, and test whether a flood or depletion strategy is reaching intended zones.
🧭 Formation Testing for Pressure and Samples
Wireline formation testers can measure pressure at selected depths and collect fluid samples. Pressure gradients help identify fluid contacts, compartmentalization, and communication between layers.
Sampling adds direct evidence about oil, gas, condensate, or water, but samples can be contaminated by drilling mud filtrate. Adequate cleanup and careful quality control are essential before laboratory results are used for major development decisions.
🧠 Combining Logs With Core, Tests, and Production
Core provides direct measurements of grain size, porosity, permeability, capillary behavior, and rock fabric. Drill stem tests, pressure data, and production tests add dynamic evidence of flow. Logs connect these sparse but powerful observations continuously across the well.
A robust workflow calibrates logs to core where core exists, checks saturation models against fluid samples and pressures, and revises the model when production contradicts predictions. Interpretation should improve as new evidence arrives.
⚠️ Common Interpretation Mistakes
- Calling every low gamma ray bed a reservoir: clean rock can still be tight or water-bearing.
- Calling every high-resistivity interval hydrocarbon: fresh water, tight rock, and invasion may mislead.
- Ignoring environmental corrections: mud type, borehole size, invasion, and tool standoff influence readings.
- Using one model everywhere: clean sands, shaly sands, carbonates, and fractured reservoirs need different assumptions.
- Forgetting uncertainty: a precise-looking curve does not guarantee a precise geological conclusion.
🛠️ A Practical Interpretation Sequence
- Verify depth, curve quality, tool configuration, and borehole conditions.
- Identify major lithology and stratigraphic intervals.
- Estimate shale volume and porosity using appropriate environmental corrections.
- Assess resistivity in the context of fluids, invasion, and formation-water properties.
- Estimate saturation and define provisional net pay with documented cutoffs.
- Compare results with core, pressures, tests, seismic, and offset-well outcomes.
- Translate the interpretation into a specific decision: drill, steer, case, test, perforate, monitor, or abandon.
🤝 The Multidisciplinary Decision Room
Logs become most valuable when specialists share the same question. The geologist may focus on depositional continuity, the petrophysicist on saturation uncertainty, the drilling engineer on wellbore placement, and the completion engineer on isolation and perforation choices.
Disagreement is useful when it exposes assumptions. A quick cross-functional review can prevent a technically elegant log interpretation from becoming an impractical completion plan.
📈 Data Quality Is an Economic Issue
Acquiring every available log is not always justified, but acquiring too little data can leave costly ambiguity. The right program depends on formation complexity, well objective, drilling risk, availability of offset data, and the value of the decision being made.
For an appraisal well, pressure sampling and image logs may reduce uncertainty that affects field development. For a low-risk development well in a well-understood reservoir, a focused suite may be more efficient.
🌱 Logging and Responsible Field Development
Better subsurface characterization can reduce unnecessary sidetracks, improve placement of wells and completions, and identify unwanted water production earlier. These outcomes can reduce energy and material use per productive interval, although logging itself does not remove the environmental impacts of hydrocarbon development.
Logs also support well-integrity evaluation, abandonment planning, and monitoring of injection or storage projects. Their value increasingly extends beyond finding hydrocarbons to understanding how fluids move underground.
🔑 The Core Principle: Logs Reduce Decision Uncertainty
The real-world use of well logging is not merely generating colorful curves. It is converting physical measurements into defensible choices under geological uncertainty. A gamma ray curve may guide correlation; a resistivity response may refine fluid interpretation; a pressure measurement may change the entire reservoir model.
The strongest interpretation is transparent about assumptions, checks multiple independent measurements, and remains open to revision. In petroleum engineering, logs are most useful when they are treated as evidence in a larger subsurface story—not as a shortcut around that story.
Well logging earns its value when reliable measurements, sound geological context, and a clear operational decision are brought together. That combination turns a borehole into information that can guide exploration, development, production, and long-term well management. 🛢️📊🧭