
A well can appear to be producing normally while its performance is quietly changing. A small fall in oil rate, a rising water cut, or a few extra hours of downtime may be easy to miss during a busy shift. By the time the pattern is obvious, the team may have lost valuable production information.
A basic production monitoring sheet turns field observations into a usable record. It does not replace allocation software, laboratory analysis, well testing, or engineering judgment. It gives operators and engineers a consistent daily picture from which those higher-level decisions can begin.
For students, the sheet is a practical way to connect reservoir behavior, artificial lift, separation, metering, and operations. For working professionals, it is often the first place where a developing problem becomes visible.
The goal is not to collect every available number. The goal is to collect a small set of trustworthy measurements, record the conditions behind them, and review the resulting trends often enough to act.
🧭 What a Production Monitoring Sheet Does
A production monitoring sheet is a structured daily, shift-based, or test-period record for one well. It brings together production volumes, operating conditions, downtime, and observations that would otherwise sit in separate notebooks, control-system screens, and verbal handovers.
Its main value is comparison. A single oil-rate entry is a snapshot; many consistent entries create a trend. That trend can indicate natural decline, a choke change, liquid loading, pump wear, increasing water production, a meter issue, or a facility constraint.
🎯 Define the Sheet’s Decision Purpose
Start by asking what decisions the sheet should support. A simple lease with manually gauged tanks needs a different sheet from a pad with multiphase meters and variable-speed electric submersible pumps.
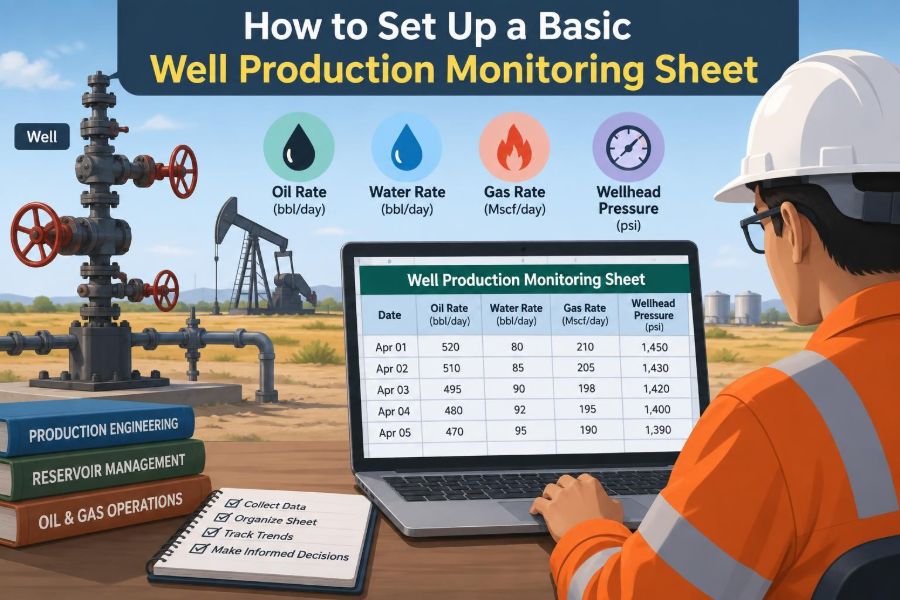
At a basic level, the sheet should help the team answer: Is the well available? How much oil, water, and gas is it producing or assigned? Is its operating condition changing? What happened today that affects interpretation?
Do not design a sheet around available data alone. Design it around the decisions that operators, production engineers, and supervisors need to make.
🗂️ Identify the Well and Reporting Period
Every entry needs unambiguous identification. Include the field or lease, well name or number, API or internal identifier where used, pad, flowline destination, and the reporting date.
Also state the reporting window, such as 06:00 to 06:00, calendar day, or one operating shift. A daily volume without a defined time basis can be misread, especially after shutdowns, handovers, or delayed measurements.
Keep this information at the top of the sheet rather than relying on a file name. Printed pages and exported rows easily become separated from their source workbook.
⏱️ Choose a Consistent Reporting Frequency
Daily reporting is common because it aligns with operations handovers and production accounting. It is usually frequent enough to identify operational changes without creating excessive manual workload.
Some values deserve more frequent observation. Flowline pressure, pump speed, motor load, separator pressure, and tank levels can move significantly within a day. Record a daily representative value only when the sheet clearly says how it was selected: end-of-shift reading, average, maximum, or test reading.
A measurement taken inconsistently is often worse than a less precise measurement taken consistently. Trends depend on comparable observations.
🧱 Build the Sheet Around Four Data Groups
A useful basic layout separates information into four groups: identity and time, production volumes, operating parameters, and events or comments. This prevents a crowded worksheet from becoming an unreviewable list of numbers.
| Data group | Typical fields | Why it is included |
|---|---|---|
| Identity and time | Well ID, date, reporting hours | Sets the basis for every comparison |
| Production | Oil, water, gas, total liquid | Shows delivered or allocated output |
| Operations | Pressures, choke, lift settings, run status | Explains how the well was operated |
| Events | Downtime, work performed, abnormal observations | Provides context for unusual values |
Use one row per well per reporting period in a master sheet, or one tab per well when a richer daily log is needed. The right choice is the one people can maintain and review reliably.
🛢️ Record Oil Production on a Clear Basis
Specify whether the oil figure is measured, allocated, estimated, or taken from a well test. These are not interchangeable. A test rate describes performance under test conditions, while an allocated daily volume may distribute commingled production using an allocation method.
State the volume unit used at the facility, commonly stock-tank barrels for stabilized oil. If the value comes from tank gauging, record enough supporting information elsewhere to trace it: opening and closing levels, strapping basis, transfers, and any relevant corrections.
Never present an estimate as a direct measurement. A simple status field such as M, A, E, or T can prevent major confusion later.
💧 Track Water Volume and Water Cut
Water production affects lifting cost, separation capacity, disposal requirements, corrosion risk, and the interpretation of reservoir performance. Record water volume in a stated unit and calculate water cut when oil and water volumes share the same basis.
Water cut is usually expressed as:
Water cut (%) = Water volume / (Oil volume + Water volume) × 100For example, a hypothetical well producing 20 barrels of oil and 80 barrels of water has a water cut of 80%. The number is useful only if the oil and water figures refer to the same period and measurement conditions.
🔥 Include Gas, but State Its Source
Gas production may come from a dedicated meter, a separator measurement, an allocation calculation, or an occasional well test. Identify the source and use a consistent standard-volume unit, such as standard cubic feet or thousand standard cubic feet, according to local practice.
Gas/oil ratio, commonly called GOR, can be a helpful screening indicator:
GOR = Gas volume / Oil volumeA sharp change can reflect reservoir behavior, changing separator conditions, a choke adjustment, gas interference in a pump, metering uncertainty, or changes in allocation. It is a prompt to investigate, not a diagnosis by itself.
🧮 Add Derived Values Carefully
Calculated columns make trends easier to see. Common examples are total liquid, water cut, GOR, uptime percentage, and rate normalized to operating hours.
Liquid rate = Oil rate + Water rate
Uptime (%) = Run hours / Scheduled hours × 100
Protect formula cells and visibly flag missing inputs. A calculated water cut of zero caused by a blank water cell is misleading; it should remain blank or show an error condition until the source data are confirmed.
📏 Separate Volumes from Rates
A volume is the amount produced over a period. A rate expresses that volume per unit time. Confusing the two is a common source of false conclusions after partial-day operation.
If a well produced 24 barrels during 12 run hours, its observed average over the full 24-hour calendar day is 24 barrels per day, but its run-time-normalized rate is 48 barrels per producing day. Both can be useful, provided the sheet labels them clearly.
Always record run hours beside a daily volume. Without them, a production decline may simply be downtime.
⏳ Account for Downtime Explicitly
Include planned and unplanned downtime, preferably with start time, end time, duration, and a brief reason code. Typical categories include electrical outage, facility shutdown, pump trip, flowline repair, well intervention, weather restriction, and awaiting service.
A free-text note adds context that a code cannot capture. “Pump restarted after high motor-temperature trip” is more useful than “equipment issue.” Avoid vague comments such as “down” when the cause is known.
Downtime is operational data, not a footnote. It separates lost availability from a well’s underlying productive capability.
🔧 Capture Artificial-Lift Conditions
Many wells cannot be interpreted without their lift settings. The relevant fields depend on the lift method: rod-pump stroke length and strokes per minute, ESP frequency and motor current, gas-lift injection pressure and rate, or plunger-lift cycle information.
Record changes, not just the latest setting. A drop in fluid rate after an ESP frequency reduction may be expected. The same drop without any operating change may require a different investigation.
Do not overload a basic sheet with every control-system tag. Select the few parameters that are most likely to explain daily performance changes.
📉 Monitor Key Pressures
Useful pressure fields may include wellhead tubing pressure, casing pressure, flowline pressure, separator pressure, and pump intake or discharge pressure where available. The appropriate set depends on well design and surface configuration.
Pressure trends are usually more informative than isolated readings. Rising flowline pressure with falling liquid rate might point toward downstream restriction, liquid holdup, or changed facility conditions. It does not prove any one cause without supporting checks.
Label the measurement location and unit. “Pressure: 150” is not meaningful; “flowline pressure: 150 psi” is.
🎛️ Document Chokes and Valve Positions
For flowing wells, choke size or choke setting often has a direct effect on rate and pressure. Record it whenever it changes, and distinguish a fixed bean size from an adjustable choke percentage if both are used at the site.
Valve positions can be misleading when their status is not standardized. Rather than writing “half open,” use the applicable operating convention, such as a documented percentage, turns from closed, or tagged position indicator.
A production trend without choke history can lead analysts to confuse an intentional operating adjustment with reservoir decline.
🌡️ Note Temperature and Fluid Appearance
Temperature can help explain viscosity changes, separator behavior, hydrate risk in appropriate systems, and instrument anomalies. It is especially useful when measured at a consistent point, such as the wellhead or separator inlet.
Qualitative observations also matter. An operator may note emulsion, foaming, sand, unusual odor, oil sheen near equipment, pulsation, leaks, vibration, or changing fluid color. These observations should be factual and specific, not speculative.
For example, write “intermittent gas slugs observed at separator inlet” rather than “well is loading up” unless the cause has been established.
🧪 Distinguish Test Data from Allocation Data
Well tests aim to isolate or estimate a particular well’s contribution over a controlled period. Allocation distributes commingled production among wells using a defined method. Both are valuable, but they answer different questions.
Include columns for data source and test date when daily production is allocated. If the allocation uses an older test factor, the sheet should make that visible so users understand the uncertainty behind an apparent rate change.
A basic monitoring sheet should not silently combine tested oil with allocated water and an estimated gas figure without identifying the different bases.
✅ Establish Data Validation Rules
Validation catches entry errors before they become trend lines. Set realistic allowed ranges for fields, standardized units, and drop-down options for recurring categories such as status, data source, and downtime reason.
Useful checks include:
- Run hours cannot exceed scheduled hours.
- Water cut must fall between 0% and 100% when valid oil and water volumes exist.
- Production cannot be entered as positive when the well is marked shut in unless the entry represents a carryover volume and is explained.
- Pressure fields require a unit and measurement point.
- A major rate change prompts a comment or verification flag.
Validation should warn users, not prevent legitimate unusual events from being recorded.
🧹 Make Missing Data Visible
Blank cells, zeros, and unavailable readings mean different things. A zero oil rate may represent a true shutdown; a blank may mean the meter was not read; “N/A” may mean the parameter does not apply to that well.
Use a consistent convention and document it in a notes tab or header. Avoid filling gaps with invented values merely to keep charts continuous. A visible gap is honest and may reveal a maintenance or reporting problem worth fixing.
🧾 Create Useful Event Codes
Short event codes make filtering possible, while descriptions preserve detail. Keep the code list limited and meaningful. A long list of nearly identical categories causes inconsistent use.
One practical approach is to group events by equipment, flow assurance, facility, power, well intervention, and external constraint. A comment field can then state the particular condition, action taken, and whether the well returned to service.
Review new events periodically. If “other” becomes common, the coding system is not capturing the operation adequately.
📝 Write Comments That Future Users Can Understand
Comments should explain what changed, when it changed, and what was done. They should not be a place for unsupported conclusions or blame.
A strong comment might read: “Flowline pressure increased after separator pressure control work at 14:00; choke unchanged; operator notified.” This helps an engineer connect a pressure shift to a facility event days later.
Include names only where site procedures require them. The operational record should stand on its own even when the original shift team is unavailable.
📊 Use Trend Charts, Not Just Rows
A sheet becomes far more useful when its key fields are plotted. At minimum, chart oil rate, water rate or water cut, run hours, and one or two relevant operating parameters such as tubing pressure or pump frequency.
Place downtime markers or event labels on the chart when possible. A sudden decline that aligns with reduced run hours is different from a decline during steady operation.
Do not compress unrelated scales onto one confusing chart. Separate plots often reveal relationships more clearly than a crowded dashboard.
🔎 Compare Like with Like
Before comparing two dates, check whether the operating basis was similar. Was the well flowing through the same choke? Was the separator at a comparable pressure? Did the pump run for the same number of hours? Did the measurement method change?
This principle is especially important after facility modifications or a switch from estimated to metered data. A chart can be mathematically correct while its apparent trend is operationally incomparable.
When conditions differ, annotate the change rather than forcing a direct interpretation.
⚠️ Recognize Common Trend Signals
Patterns can direct attention, but they are not automatic diagnoses. A gradual oil decline with stable uptime and lift settings may justify review of well performance. Rising water cut can reflect reservoir movement, conformance issues, mechanical communication, or changing allocation, among other possibilities.
Other screening patterns include:
- Stable liquid rate with declining oil rate and rising water rate.
- Falling liquid rate accompanied by rising flowline pressure.
- Increasing casing pressure with reduced tubing production under otherwise similar conditions.
- Repeated trips, short run periods, or unstable pump current.
- A sudden production step that coincides with a meter, choke, or test-method change.
Use the sheet to trigger verification, field checks, tests, and engineering review—not to make a final diagnosis from one variable.
🧠 Keep Measurement Uncertainty in View
Every production figure has uncertainty. Tank gauging can be affected by level reading, temperature, basic sediment and water handling, transfers, and strapping accuracy. Multiphase measurements, allocation factors, and separator tests each have their own limitations.
Record the method and changes in method. If a value is estimated, say so. This habit prevents users from treating all columns as equally precise and helps explain differences between operations data and final accounting volumes.
Precision in formatting is not the same as accuracy in measurement. Reporting 12.347 barrels does not make a field estimate more reliable than its method supports.
🖥️ Choose a Practical Tool and Layout
A spreadsheet is often sufficient for a basic monitoring sheet, particularly where data are manually entered or reviewed. Use protected formulas, clear units in headers, frozen identifiers, controlled drop-down lists, and a separate raw-data area if imports are involved.
For larger operations, a database, historian, or production surveillance platform may reduce transcription and improve access. However, software does not solve unclear definitions or inconsistent field practices.
Keep the first view usable on a normal screen or printed page. If users must scroll through dozens of columns to find oil rate and downtime, the design is working against review.
🔐 Control Revisions and Data Ownership
Assign responsibility for entering data, checking exceptions, approving corrections, and maintaining field definitions. Without ownership, a sheet gradually becomes a mixture of assumptions from different users.
Do not overwrite a confirmed historical number without a trace. Record the correction date, reason, and source where the workflow requires auditability. This is particularly important when operating data feed production accounting, regulatory reporting, or commercial decisions.
Restrict editing of formulas and reference lists while allowing field personnel to add necessary operational comments.
🤝 Design for Operators and Engineers Together
Operators know what was observed and done at the wellsite. Engineers interpret patterns across time, wells, and facilities. The monitoring sheet should support both roles rather than becoming an office-only reporting exercise.
Ask operators whether each manual field can be measured safely and consistently during routine rounds. Ask engineers whether the field explains a meaningful production behavior. Remove fields that satisfy neither question.
A brief feedback loop after a few weeks of use is often more valuable than trying to perfect the first version from a desk.
🦺 Put Safe Work Ahead of Data Collection
No data point justifies bypassing site procedures, entering a restricted area, opening equipment, or taking a reading from an unsafe position. Use readings available through approved gauges, control systems, and established rounds.
If a measurement cannot be safely obtained, record it as unavailable and communicate the condition through the appropriate operational process. The sheet is a monitoring tool, not a reason to create exposure to pressure, hydrocarbons, electricity, rotating equipment, or traffic hazards.
Local procedures, equipment manuals, and competent site supervision govern how measurements are taken.
🚫 Avoid the Most Common Sheet Failures
The first failure is collecting many fields that nobody reviews. The second is reviewing a few fields whose definitions change from day to day. Both create an illusion of control without dependable surveillance.
Other frequent problems include mixing units, leaving downtime unexplained, using zero for missing data, hiding formula errors, copying prior-day values without verification, and treating allocation results as direct measurements.
Correct these issues with simpler design, clear field definitions, and a routine review—not with more columns.
🛠️ A Simple Build Sequence
- List the decisions the sheet must support and the people who use it.
- Define the reporting period, units, measurement points, and data-source labels.
- Add essential identity, production, run-hour, operating, and event fields.
- Build formulas for total liquid, water cut, GOR, and uptime only where inputs are compatible.
- Add validation rules, a short event-code list, and a clear missing-data convention.
- Trial the sheet on a small number of wells, then revise it using operator and engineer feedback.
- Create simple trend plots and establish who reviews exceptions each day or week.
Begin with the minimum viable sheet. Expansion is easy after the team has demonstrated that the basic data are reliable.
📋 Example of a Basic Daily Record
A hypothetical row might show: Well A-12, reporting date and 24 scheduled hours, 22 run hours, 18 barrels of oil, 42 barrels of water, 60 barrels of liquid, 70% water cut, a stated gas volume and source, tubing pressure, flowline pressure, ESP frequency, and “2-hour power outage; restarted normally.”
That one row does not diagnose the well. Over several days, however, it can show whether the post-outage rate recovered, whether water cut shifted, and whether pressure or lift conditions changed at the same time.
The strength of the example is not its number of columns. It is the connection between production, operating time, conditions, and events.
🏁 The Core Principle: Context Makes Data Useful
A basic well production monitoring sheet succeeds when every key number has a clear basis and enough context to be interpreted. Production volumes need run hours. Rate changes need operating conditions. Unusual readings need events, data source, and measurement method.
Reliable surveillance is built from consistent field practice, transparent uncertainty, and regular review. A sophisticated dashboard built on ambiguous inputs cannot provide better decisions than a well-maintained simple sheet.
Capture fewer data points well, connect them to operating context, and use trends to ask better questions about the well.
A clear, consistently used monitoring sheet gives the field team a shared operational memory—and gives production decisions a firmer foundation. 🛢️📈🔧