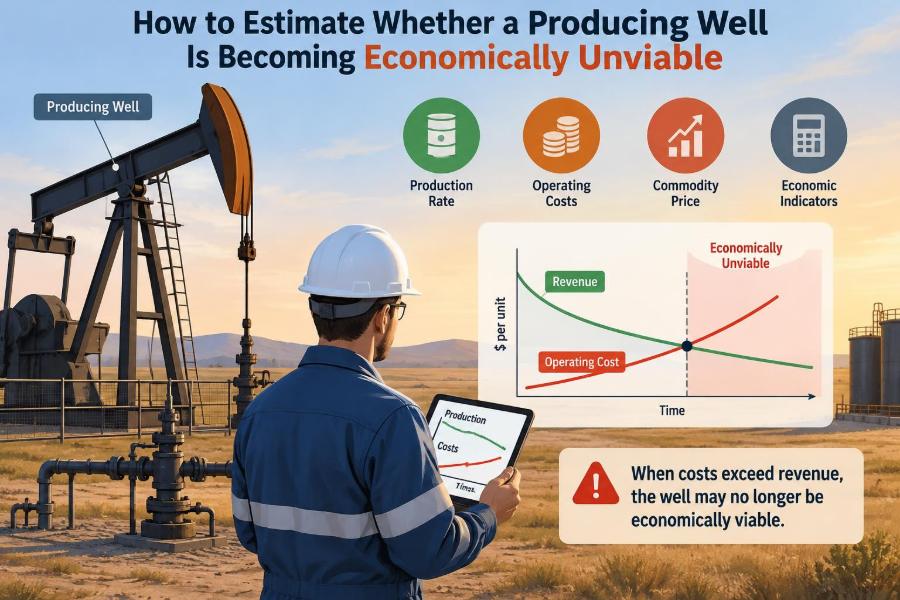

A producing well can still be flowing, pumping, and appearing healthy at the surface while quietly becoming a poor economic decision. The tank has oil in it, the pumpjack is moving, and operators are busy—but the margin between revenue and cost may be shrinking every month.
This is a familiar situation in mature fields. Water production rises, equipment needs more attention, oil rates decline, and disposal invoices become harder to ignore. The question is no longer simply, “Can this well produce?” It is, “Should this well continue producing?”
That distinction matters because a well does not need to be physically depleted to become economically unviable. It only needs to generate less value than it consumes after the costs and risks of keeping it active are properly counted.
A sound economic estimate helps engineers, production teams, and asset managers decide whether to optimize, repair, suspend, convert, or abandon a well. It also prevents a common mistake: treating a technical decline as an automatic reason to shut in—or treating continued production as proof that a well is worth keeping.
🧭 Start With the Right Economic Question
Economic viability is usually assessed on an incremental basis. Ask what cash flow the well will create from this point forward if it remains online, compared with the cash flow if it is shut in, repaired, or abandoned.
Past drilling and completion expenditures are generally sunk costs. They may matter for accounting and field-level learning, but they cannot be recovered by operating a well that loses money today.
The practical question is: Will expected future revenue exceed the future costs, obligations, and capital needed to keep this specific well operating?
📉 Separate Physical Decline From Economic Decline
Physical decline means the well produces less oil, gas, or liquids over time. Economic decline occurs when the remaining production can no longer support operating costs and required future spending.
A low-rate well may still be profitable if it has low lifting costs, little water, reliable equipment, and useful associated gas. Conversely, a higher-rate well can be uneconomic if it requires frequent workovers, expensive artificial lift, or large-volume water disposal.
Production rate alone is therefore a weak screening metric. Value per unit and cost per unit matter just as much.
🛢️ Establish the Revenue Stream
For an oil well, gross revenue begins with expected oil sales volume multiplied by the expected realized oil price. The realized price is not necessarily the benchmark price quoted in the market; quality differentials, transport charges, marketing terms, and local constraints can reduce it.
Gas, natural gas liquids, condensate, and other saleable streams can add value. In some wells, associated gas is a meaningful credit. In others, gas handling, compression, or flaring restrictions create a cost instead.
A simple monthly oil-revenue estimate is:
Oil revenue = Oil volume × realized oil price
Use a consistent basis. If production data are in barrels per day, convert to the expected producing days in the month. If sales are measured at a different point than production, account for the difference appropriately.
💧 Treat Water as a Cost Driver, Not a Side Note
Produced water often determines the economics of an aging oil well. Water must be lifted, separated, treated where necessary, transported or injected, and handled within operating and environmental requirements.
As water cut rises—the fraction of produced liquid that is water—the well may move less saleable oil while handling roughly the same or greater liquid volume. This can increase power use and disposal cost at precisely the time revenue is falling.
Water does not make a well uneconomic by itself. A field with nearby, spare disposal capacity faces a different cost structure than an isolated lease trucking water long distances. The relevant number is the marginal cost of handling this well’s additional water.
⚙️ Identify Direct Operating Costs
Direct operating costs are expenses that change because the well remains active. They often include:
- Artificial-lift electricity or fuel
- Routine field labor and wellsite visits
- Chemicals for corrosion, scale, emulsion, or paraffin control
- Water hauling, treatment, and disposal
- Minor maintenance and replacement parts
- Compression, gathering, and processing charges
- Production taxes, royalties, and transportation deductions
Not every field records these costs at individual-well level. When costs are shared, allocate them carefully, but do not assume every corporate overhead charge disappears if one well is shut in. That distinction is critical for a shut-in decision.
🏗️ Distinguish Avoidable Costs From Allocated Costs
An accounting statement may assign a share of field supervision, roads, facilities, insurance, or office support to each well. Those allocations are useful for full-cost reporting, but they can mislead operating decisions.
For a near-term decision, focus first on avoidable costs: expenses that would actually be saved if the well stopped producing. A well may look unprofitable after allocated overhead yet still generate positive incremental cash that helps support a facility already operating.
The opposite problem also occurs. If a well creates operational complexity, increases emissions-monitoring effort, or forces expensive equipment to remain in service, its true avoidable cost may be larger than a simple allocation suggests.
💸 Include Royalties, Taxes, and Price Deductions
Gross revenue is not operating cash flow. Royalties, severance or production taxes where applicable, transport deductions, and processing fees may all reduce the revenue retained by the working-interest owner.
These charges may be expressed as percentages, fixed fees, or contract-specific formulas. They should be modeled according to the actual commercial arrangement rather than assumed as one universal rate.
A useful shortcut for early screening is to convert price into a netback: the money retained per barrel or per unit of gas after price-related deductions. The netback can then be compared with variable operating cost per unit.
🔌 Calculate Lifting Cost Realistically
Lifting cost is the cost to bring produced fluids to the surface. It includes more than the electricity bill for a pumping unit. Rod-pump failures, gas-lift compression, progressive cavity pump servicing, chemical use, and fluid handling may all be part of the lifting burden.
For example, a well with declining oil production but increasing fluid rate may require more power to lift each barrel of oil sold. Its cost per barrel of oil rises even if the monthly power invoice barely changes.
Tracking cost per barrel of oil equivalent can be useful, but do not let a blended metric hide a water problem. For liquid-heavy wells, cost per barrel of oil and cost per barrel of produced water can reveal more.
📊 Use a Simple Monthly Cash-Flow Screen
A first-pass operating screen can be built from actual recent data and a short forecast. The goal is not a perfect reserve model; it is a transparent view of whether the well is presently contributing cash.
| Item | Illustrative monthly calculation | Economic meaning |
|---|---|---|
| Oil sales | Oil volume × realized price | Primary revenue source |
| Other hydrocarbon sales | Gas, condensate, or NGL value | Additional revenue or credit |
| Revenue deductions | Royalties, taxes, transport, processing | Reduces gross sales to net revenue |
| Variable operating costs | Power, chemicals, water, routine labor | Costs avoided or reduced on shut-in |
| Maintenance reserve | Expected recurring repair burden | Reflects predictable future failures |
| Net operating cash flow | Net revenue − operating costs | Initial viability indicator |
This screen should be reviewed over several months. A single month can be distorted by a tank draw, temporary downtime, a one-off repair, or timing differences in invoices.
📈 Forecast Production Rather Than Extrapolating One Month
Recent production should be interpreted as a trend, not simply annualized. Decline-curve analysis is commonly used to forecast how oil, gas, and water rates may change with time.
In simple terms, the forecast should reflect the well’s observed behavior, operating history, reservoir context, and any known upcoming changes. A smooth mathematical decline curve is helpful, but it should not override evidence of changing water breakthrough, artificial-lift limitations, or wellbore damage.
Forecasting is uncertain. Use a reasonable range of cases rather than presenting one decline rate as a certainty.
🧪 Check Production Data Quality First
Economic calculations are only as credible as the production allocation behind them. Incorrect test factors, uncalibrated meters, estimated water volumes, commingled production, and late ticket entry can materially change a marginal well’s apparent performance.
Before recommending abandonment, check whether the oil rate is based on recent tests, whether downtime was coded correctly, and whether water volume reflects measured disposal or a calculated estimate.
A suspicious result deserves a field check. Sometimes the most valuable “economic intervention” is correcting a faulty level controller, separator setting, meter, or allocation factor.
🧰 Recognize the Role of Workovers
A well can generate positive monthly cash flow but still be economically unattractive if it requires a large near-term workover. Examples include tubing replacement, rod-string repair, pump replacement, scale remediation, casing repair, or a recompletion.
Such expenditures should be evaluated as investments. Estimate the incremental production or cost reduction expected after the work, then compare it with the workover cost, risk, and expected duration of benefit.
Do not assume every repair restores prior production. A failed pump may be a mechanical issue; a falling fluid level or depleted inflow may indicate that a new pump will not solve the underlying limitation.
🧮 Apply Incremental Net Present Value
For decisions involving future spending, monthly cash flow is not enough. Use net present value (NPV), which discounts future cash flows because money received sooner is generally more valuable and because future production is uncertain.
Incremental NPV = present value of future net cash flow − required future capital
Compare alternatives on the same basis: continue as is, repair, optimize artificial lift, shut in temporarily, convert to injection, or abandon. The preferred option is not always the one with the highest initial production rate; it is the option with the best risk-adjusted future value.
⏳ Account for Remaining Economic Life
Economic limit is the point at which continued operation is no longer expected to cover the applicable costs. It can be expressed as a rate, but it is better understood as a moving condition affected by price, water handling, operating efficiency, and future capital.
Remaining economic life may be months or years. A well approaching its limit can still justify operation if it has positive cash flow and no disproportionate liability exposure. But the closer it gets, the more frequently assumptions should be revisited.
Economic limits are not fixed reservoir properties. They change when oil prices, disposal capacity, power costs, regulations, or facility conditions change.
📍 Consider Field-Level Dependencies
A single-well decision can affect the economics of nearby wells. Shutting in one producer may reduce the fluid volume through a shared separator, pipeline, heater, or water-disposal system, increasing unit costs for the remaining wells.
Conversely, a troublesome marginal well may consume disproportionate operator time, disrupt a shared facility, or constrain disposal capacity needed by better wells. Individual well cash flow must therefore be viewed alongside field-level consequences.
Document the decision boundary clearly: are you evaluating the well alone, the pad, the lease, or the field? Different boundaries can produce different—but valid—answers.
🛠️ Examine Artificial-Lift Efficiency
Artificial lift can turn a viable well into a marginal one when it is poorly matched to current conditions. A rod pump may be oversized or undersized; gas interference may reduce pump fillage; a gas-lift well may have unstable injection; an electric submersible pump may be operating far from its efficient range.
Optimization may improve economics without adding reserves. Adjusting pump speed, stroke, submergence, gas separation, injection rate, or operating schedule can reduce power consumption and deferred production.
However, optimization has limits. If reservoir inflow is genuinely low, forcing higher drawdown can accelerate failures or produce more water without creating enough additional oil value.
🧱 Assess Integrity and Environmental Exposure
A well with positive operating cash flow may still require intervention because of mechanical integrity concerns. Corroded tubing, compromised casing, sustained casing pressure, leaking valves, and poorly understood barriers can create risks beyond routine production economics.
Potential remediation, monitoring, and eventual abandonment costs must be considered. A decision to keep producing should not defer a known integrity issue merely because this month’s operating statement is positive.
Requirements differ by jurisdiction and operating agreement. The relevant engineers, regulatory personnel, and legal specialists should confirm obligations for a specific well.
🧾 Include Future Plugging and Abandonment Liability
Every producing well will eventually require plugging and abandonment, along with surface restoration where applicable. These costs can be significant and highly variable depending on depth, well condition, access, cement requirements, and regulatory scope.
Abandonment cost should not automatically be charged in full against one month of production. Yet it must appear in long-term economic planning because delaying abandonment can increase liability, and a deteriorating well can become more expensive to plug.
A practical approach is to evaluate whether continued operation generates enough future net cash to justify both the operating period and the consequences of deferring final abandonment.
🌡️ Run Price and Cost Sensitivities
Commodity prices are uncertain, and marginal wells are highly sensitive to modest changes in price or cost. A base case should be supplemented with lower-price and higher-cost cases, especially where water hauling, fuel, or power expenses are material.
Sensitivity analysis does not predict the market. It reveals which assumption drives the decision and how fragile the economics are. A well that is viable only under an optimistic price assumption deserves particular caution.
Consider testing changes in oil price, water-disposal cost, uptime, workover cost, decline rate, and realized differential. These are often more informative than adding false precision to a single forecast.
🧷 Use Break-Even Rate as a Communication Tool
A break-even oil rate estimates how much oil production is needed to cover relevant costs at a given netback and water rate. It can help operations teams see the practical gap between current performance and economic performance.
In a simplified form:
Break-even oil rate = monthly costs not covered by water or other revenue ÷ net revenue per barrel of oil
This is a screening tool, not a full decision model. If water volume changes with oil rate, or if costs are stepped rather than linear, a simple break-even calculation can mislead. Still, it is useful for identifying whether optimization has a plausible target.
🔄 Compare Continue, Repair, Suspend, and Abandon Options
Economic viability is rarely a binary choice. Several alternatives may be available, each with different cost, timing, and risk.
- Continue operating: appropriate when future net cash flow remains positive and integrity is acceptable.
- Optimize: improve lift, reduce water cost, lower energy use, or address a specific restriction.
- Repair or work over: invest capital when expected incremental value justifies the risk.
- Temporarily suspend: preserve an option while awaiting a facility change, price improvement, or coordinated field activity.
- Convert: use the well for injection, disposal, observation, or another approved purpose where technically justified.
- Abandon: remove an uneconomic or risky well from the operating inventory and address its final liability.
Temporary suspension is not free. Wells still require surveillance, barriers, regulatory compliance, and eventual return-to-service or abandonment decisions.
🧠 Avoid the Sunk-Cost Trap
It is natural to remember the money spent drilling, completing, and maintaining a well. But continuing to spend money because “we have already invested so much” can turn a historical loss into a larger future loss.
The correct comparison is forward-looking. If the same capital could be spent on another well, a facility bottleneck, water infrastructure, or abandonment of a high-risk liability, that opportunity cost should influence the decision.
Past investments still provide useful lessons about reservoir quality and failure modes. They should inform engineering judgment, not dictate an uneconomic operating choice.
🚫 Do Not Confuse Cash Flow With Profitability
Positive cash flow means the well brings in more cash than the selected near-term costs. It does not necessarily mean the project earns an adequate return after capital, abandonment liability, depreciation, financing, or full corporate costs.
Both measures have uses. Near-term cash flow supports operating decisions, while fuller economic analysis supports capital allocation and portfolio management. Problems arise when a team uses one measure while assuming it answers the other question.
State the metric explicitly in reports: incremental operating cash flow, field contribution, NPV, payout, or full-cycle return.
📅 Review Marginal Wells on a Defined Schedule
Marginal wells should not be evaluated once and forgotten. A monthly operating review may be suitable for wells near economic limit, while a more stable well may only need periodic forecasting.
Create triggers for re-evaluation, such as a sustained rise in water cut, repeated failures, a price change, a major maintenance estimate, or a drop in uptime. A clear trigger prevents decisions from being driven solely by the loudest current problem.
Trend charts are often more useful than one-page snapshots. Show oil rate, water rate, downtime, direct cost, and net cash flow on a consistent time basis.
👷 Bring Operations Into the Economic Model
Field operators often know whether a well requires daily attention, whether a tank overflows after storms, or whether a pump is beginning to fail long before those details appear in a cost report. Their input improves the realism of forecasts.
Likewise, engineers should explain the economic logic behind operating priorities. A request to reduce chemical usage or optimize run time is more likely to succeed when the team understands the specific cost or risk it addresses.
The best evaluations combine production data, reservoir and lift knowledge, maintenance history, commercial terms, and field experience.
🧩 Work Through a Hypothetical Example
Consider a hypothetical mature oil well producing a modest oil rate and a much larger water rate. Its oil sales create positive gross revenue, but royalties and transport deductions reduce the retained amount. Water disposal, power, chemicals, and routine labor consume most of what remains.
If the well has stable uptime and needs no major repair, it may still produce a small positive monthly contribution. That can justify continued operation in the short term, particularly if shared facilities would remain active regardless.
Now assume the pump is likely to need a costly replacement and the production forecast continues downward. The decision changes from “Does this month make cash?” to “Will the repair generate enough discounted future cash to recover its cost before the next intervention or abandonment?” That is the point where an NPV comparison becomes essential.
🔍 Document Assumptions and Uncertainty
An economic recommendation should show its assumptions clearly: price basis, forecast period, decline behavior, uptime, water cost, repair scope, disposal route, discounting approach, and abandonment treatment.
Clear assumptions allow someone else to test the result when conditions change. They also reveal whether the conclusion depends on a single fragile input, such as an unconfirmed repair estimate or unusually favorable oil differential.
Do not hide uncertainty behind many decimal places. A range with a stated rationale is usually more honest and more useful than a precise-looking number with weak inputs.
📋 Build a Repeatable Decision Workflow
A consistent workflow helps teams make comparable decisions across a large well inventory:
- Verify recent oil, gas, water, and downtime data.
- Calculate realized revenue after applicable deductions.
- Identify direct and avoidable operating costs.
- Forecast production, water handling, uptime, and expected repairs.
- Screen near-term operating cash flow.
- Evaluate capital alternatives using incremental NPV.
- Review integrity, regulatory, and abandonment obligations.
- Run sensitivities and compare practical options.
- Record the decision, assumptions, owner, and review date.
This process is simple enough for routine asset surveillance but rigorous enough to expose the assumptions that truly drive a marginal-well decision.
✅ The Core Principle: Value the Next Barrel Forward
A producing well becomes economically unviable when its expected future value no longer justifies the costs, capital, risk, and liability of keeping it active. The answer cannot be read from production rate, water cut, or a single monthly invoice alone.
Estimate future net revenue using realistic prices and deductions. Subtract costs that are genuinely caused by continued operation. Then include likely repairs, production decline, uncertainty, integrity exposure, shared-facility effects, and eventual abandonment obligations.
The most defensible choice is often not dramatic. It may be a targeted optimization, a carefully justified workover, continued operation with close monitoring, or timely abandonment. What matters is that the choice is based on forward-looking economics supported by sound engineering judgment.
A well should be kept online because the next period of operation creates credible net value—not simply because it produced in the last one. 🛢️📊🔧