
A well that once delivered mostly oil can gradually become a water-handling problem. Tank volumes rise, separators work harder, treating costs increase, and the oil rate may decline even though total liquid production looks healthy.
For a field operator, this change is more than an inconvenience. Produced water affects lifting requirements, corrosion risk, chemical use, disposal capacity, emissions from pumping, and the economics of every barrel of oil that reaches the surface.
Water production is also not automatically a sign of poor engineering. Many reservoirs naturally produce increasing water as they mature. The engineering challenge is to determine where the water comes from, why it is reaching the well, and whether intervention will improve the whole system.
That diagnosis requires reservoir, production, completion, and facilities data to be read together. A quick fix based only on water cut can easily damage oil production or spend money on a problem that is actually occurring somewhere else in the production system.
🛢️ Water Is a Normal Part of Oil Production
Most oil reservoirs contain water from the beginning. This may be connate water, trapped in pore spaces since deposition, or mobile formation water connected to an aquifer below or beside the oil-bearing rock.
Some water is needed to support production. Its movement through the reservoir can help maintain pressure and displace oil toward producing wells. The problem begins when water reaches the wellbore in volumes that reduce oil recovery economics or overwhelm the available handling system.
📊 Understanding Water Cut
Water cut is the fraction of produced liquid that is water. If a well produces 100 barrels per day of liquid and 70 barrels are water, its water cut is 70 percent. It says nothing by itself about gas production or oil quality.
A rising water cut can occur while oil rate remains steady, but it often accompanies declining oil rate. Engineers therefore track oil, water, and total liquid rates separately. Looking only at water cut can hide whether water is rising, oil is falling, or both are happening.
🧭 The First Question: Where Does the Water Come From?
Water can enter a well from several places: the intended reservoir interval, an underlying aquifer, an injected-water flood, a separate watered-out layer, behind casing, or surface equipment. These sources require very different responses.
The central diagnostic task is source identification. A water shutoff treatment is unlikely to succeed if it is placed in the producing formation while the actual flow path is a casing leak or poor cement above the interval.
🌊 Natural Aquifer Encroachment
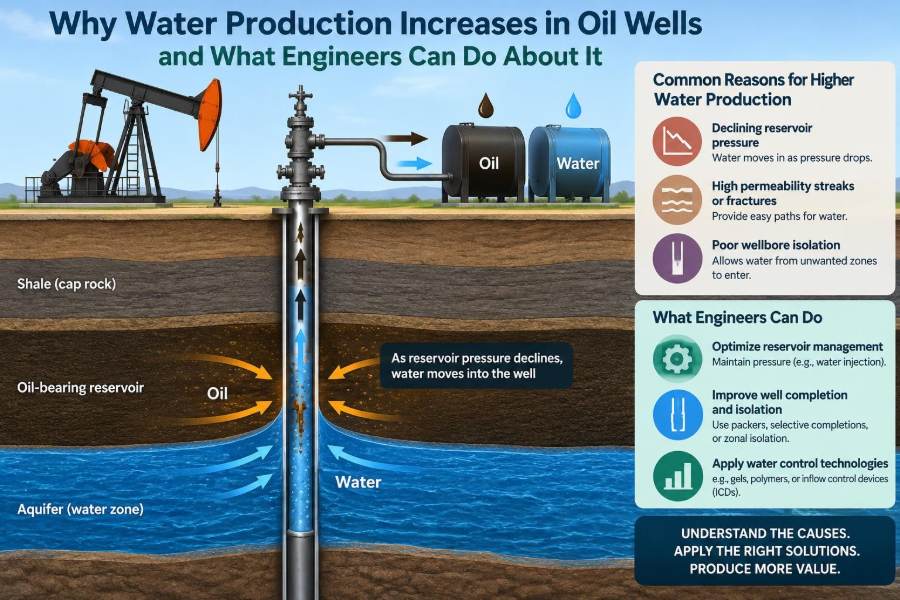
An aquifer is a water-bearing rock body hydraulically connected to the hydrocarbon reservoir. As oil and gas are withdrawn, reservoir pressure may decline and water can move upward or laterally to occupy pore volume formerly occupied by hydrocarbons.
In a strong bottom-water-drive reservoir, the oil-water contact can rise beneath a producing well. In edge-water systems, the contact advances horizontally. Neither mechanism is inherently abnormal; the production consequence depends on reservoir geometry, permeability distribution, and drawdown.
⬆️ Water Coning Below the Well
Water coning occurs when a producing well creates a local pressure sink that pulls the oil-water contact upward near the wellbore. The resulting water shape resembles a cone, although real reservoir behavior is often irregular because rock properties vary.
High production drawdown, a short distance above the water contact, and vertical permeability can all encourage coning. Reducing rate may flatten the cone in some wells, but it may also reduce valuable oil output. The right decision depends on the incremental oil and water response.
↔️ Water Cusping from the Side
Where water advances laterally, especially toward a horizontal well or a well near an edge-water boundary, the water front may form a sideways tongue or cusp. High-permeability streaks can make the advance much faster along one direction than predicted by a simple uniform-rock model.
This is why a water breakthrough does not always appear first in the lowest perforations. In layered or fractured formations, the dominant flow path may be controlled by connectivity rather than depth alone.
💉 Injected Water Breakthrough
Water injection is commonly used to maintain pressure and sweep oil toward producers. Ideally, injected water moves through a broad part of the reservoir and displaces oil. In practice, it may find a short, highly conductive route to a producer.
Early breakthrough can result from an injector-producer channel, a fracture, a thief zone, or unfavorable well placement. It does not mean waterflooding has failed; it means the flood pattern and conformance need closer examination.
🧱 Reservoir Heterogeneity Creates Fast Paths
Reservoir rock is rarely uniform. Thin high-permeability layers, channels, fractures, vugs, and faults can transmit water far more readily than tighter rock. Water follows the path of least resistance, bypassing oil in less-permeable zones.
This creates an uncomfortable combination: a producer may make large volumes of water while significant oil remains nearby. The issue is not simply too much water in the reservoir; it is poor sweep efficiency, meaning the displacing fluid has not contacted oil evenly.
🪨 Fractures and Faults Can Change the Diagnosis
Natural fractures can connect an aquifer or injector to a producer quickly. Conductive faults may do the same, while sealing faults can compartmentalize the reservoir and make neighboring wells behave very differently.
Pressure interference tests, tracer programs where appropriate, production timing, geological interpretation, and surveillance logs can help test these possibilities. A sudden water response after a nearby injection change is a useful clue, not proof of direct communication.
🧩 Layered Reservoirs and Crossflow
Many completions open several layers at once. If one layer has high water mobility and another contains movable oil, commingled production can allow the water-producing layer to dominate the total flow.
Crossflow can also occur inside the wellbore when pressure conditions differ between zones. Water may enter one interval and move to another before reaching surface. Production logging is often more informative than surface rates when this behavior is suspected.
🕳️ Unwanted Water from a Separate Zone
A completion may unintentionally include a water-bearing interval because of inaccurate depth control, reservoir uncertainty, erosion of a barrier, or changes made during workover operations. Even a thin interval can produce substantial water if it has high permeability and a favorable pressure difference.
This type of problem can sometimes be addressed by isolating or selectively treating the offending zone. The prospect is usually better when logs and mechanical data clearly locate the water entry point.
🔩 Behind-Casing Flow and Cement Problems
Water does not always enter through perforations. Poor cement isolation, channels in the cement sheath, microannuli, or failed barriers can permit water to migrate behind casing from one formation to another.
Behind-casing flow is a well-integrity issue as well as a production issue. Temperature surveys, noise logs, cement evaluation, pressure testing, and careful completion history may be needed to distinguish it from ordinary reservoir influx.
⚠️ Tubing, Casing, and Completion Leaks
Corrosion, erosion, mechanical wear, and pressure cycling can damage tubing, casing, packers, valves, or connections. A leak may admit water from a zone that was never intended to communicate with the production string.
Annulus pressure behavior, pressure tests, caliper or electromagnetic inspection tools, and well intervention records can guide diagnosis. Treating a leak as a reservoir-water problem wastes time and can leave the integrity risk unresolved.
🧪 Use Water Chemistry as a Clue
Produced-water salinity and dissolved-ion patterns can sometimes help distinguish waters from different formations, injected water, or aquifers. Changes in composition may indicate that a new source has reached the well.
Chemistry is supporting evidence, not a standalone answer. Samples can be affected by commingling, scale inhibitors, residual completion fluids, and surface contamination. Good interpretation compares representative samples with known formation and injection-water signatures.
📈 Read Production Trends, Not Single Measurements
A daily spike can result from separator upsets, sampling error, changing choke conditions, or temporary liquid unloading. A sustained trend is more meaningful, particularly when interpreted with flowing pressure, choke size, pump performance, and nearby well activity.
Useful questions include:
- Did water rise gradually or abruptly?
- Did oil rate fall at the same time?
- Did the change follow an injection, workover, or artificial-lift adjustment?
- Is the pattern limited to one well or repeated across a sector?
🧾 Build a Practical Diagnostic Workflow
A disciplined workflow reduces premature treatments. It begins with basic data quality: reliable test separation, calibrated meters, stable operating conditions, and a clear history of completion and intervention events.
- Confirm the water rate and water cut trend.
- Review reservoir position, contacts, perforations, and pressure data.
- Check mechanical integrity and annulus behavior.
- Identify inflow depth with logs when uncertainty remains.
- Compare plausible solutions against the expected oil, water, cost, and risk outcomes.
🧰 Production Logging Locates Inflow
Production logging tools measure properties such as fluid velocity, holdup, temperature, pressure, and sometimes fluid identification along the wellbore. Used under suitable flowing conditions, they can show which perforations contribute oil, water, or little flow.
These logs are especially valuable in long, commingled, deviated, or horizontal completions. Their interpretation is not automatic: flow regime, tool conveyance, well deviation, and changing conditions can affect results, so field context remains essential.
🗺️ Reservoir Surveillance Explains the Bigger Pattern
One well can identify a symptom; surveillance across the field helps explain the cause. Pressure maps, injection allocation, tracer observations, saturation logs, time-lapse seismic where justified, and material-balance work each provide a different view.
No single dataset creates a complete reservoir model. Engineers gain confidence when independent evidence points to the same mechanism—for example, a water rise, pressure communication, and geological connectivity all consistent with an injector breakthrough path.
🎛️ Control Drawdown Before Treating the Well
When coning or cusping is likely, changing drawdown may be the lowest-risk first response. Operators can adjust choke settings, pump speed, gas lift rate, or flowing bottomhole pressure to test whether a less aggressive pressure sink reduces water influx.
The trade-off is real: lower drawdown often means lower liquid and oil rates. A controlled test should define a duration, measurement plan, and decision criterion rather than becoming an indefinite reduction in production.
🧱 Selective Completion and Mechanical Isolation
If the offending interval is known, engineers may isolate it with bridge plugs, cement squeezes, straddle packers, sliding sleeves, or other completion equipment. The goal is to retain access to oil-bearing intervals while restricting water entry.
Mechanical isolation works best when the source is localized and barriers can be set reliably. It is less effective when water is arriving through a broad area, multiple layers, or an unrecognized behind-casing channel.
🧫 Chemical Water Shutoff Has Narrow Windows
Polymer gels, resins, and other chemical systems may be designed to reduce water permeability in selected pathways. They can be useful where a high-permeability water channel is identified and placement can be controlled.
They are not universal cures. A treatment that enters oil-bearing rock can impair oil productivity, and complex fracture networks may make placement uncertain. Laboratory compatibility work, injectivity assessment, and realistic post-job evaluation are essential.
🔄 Improve Waterflood Conformance
In waterflooded fields, the solution may lie at the injector rather than the producer. Adjusting injection rates or patterns, isolating thief zones, changing completion intervals, or applying conformance treatments can redirect water into less-swept rock.
Any injection change should be evaluated at pattern scale. Reducing water to one producer may lower pressure support or move the problem to another well if the underlying sweep mechanism is not addressed.
🚰 Produce, Treat, Reinject, or Dispose of Water
Sometimes the technically and economically sound choice is to continue producing water while managing it safely. Produced water may require oil removal, solids handling, scale control, corrosion control, and treatment before reinjection or disposal, depending on its composition and the local operating framework.
Reinjection can support reservoir pressure or provide disposal capacity, but injectivity, fracture pressure, compatibility, and containment must be managed. Water handling is therefore a core field-development system, not merely an end-of-pipe facility task.
⚙️ Artificial Lift Can Reveal or Worsen the Issue
Artificial lift systems must move the total fluid load, not only the oil. As water volume rises, pump sizing, gas handling, power demand, friction losses, and separator capacity can all become limiting factors.
Increasing pump speed may raise total liquid rate and pull more water into the well, especially near an active water contact. Conversely, insufficient lift can cause unstable flow and obscure the well’s true inflow behavior. Optimization needs inflow and lift analysis together.
🧯 Scale, Corrosion, and Emulsion Risks
More water changes fluid chemistry and operating risk. Mixing incompatible waters can precipitate mineral scale; dissolved gases and salts may accelerate corrosion; and tight oil-water emulsions can burden separation equipment.
Chemical treatment should follow water analysis and operating evidence rather than habit. Inhibitors, demulsifiers, oxygen control, materials selection, and monitoring programs are most effective when targeted to the actual mechanism.
💰 Evaluate Economics on a System Basis
A water-control job should not be judged only by a temporary reduction in water cut. Engineers should estimate changes in oil production, water handling, intervention cost, deferred production, integrity risk, facility constraints, and the probability that the benefit will persist.
A modest water reduction can be valuable where disposal is constrained. In another field, a costly shutoff that also sacrifices a productive oil interval may destroy value. The best option is the one that improves net field performance under realistic uncertainty.
🚫 Common Water-Control Mistakes
Several recurring mistakes make water problems harder than they need to be:
- Assuming every water increase is reservoir breakthrough.
- Using water cut without reviewing oil and total-liquid rates.
- Treating before locating the source and flow path.
- Ignoring changes in artificial lift, choke setting, or surface allocation.
- Focusing on one well while overlooking injector-pattern behavior.
- Declaring success immediately after a job without a baseline comparison.
Good decisions make uncertainty visible. They identify what is known, what is inferred, and what additional measurement could materially change the intervention choice.
🤝 Integrate Reservoir, Well, and Facilities Teams
Water production crosses organizational boundaries. Reservoir engineers assess movement and sweep; production engineers manage drawdown and lift; completion specialists address zonal isolation; integrity teams investigate barriers; and facilities teams handle treatment and disposal.
Shared diagnostics prevent locally sensible but globally harmful decisions. For example, a producer-side choke reduction may help coning but alter injection balance, while a facilities constraint may change the economic threshold for a workover.
🧠 A Hypothetical Field Example
Consider a mature producer completed across several sandstone layers. Water rises sharply after a nearby injector is returned to service. A quick interpretation might blame the injector and reduce injection immediately.
Instead, the team reviews rate history, runs a production log, and finds most water entering through a lower layer while the upper oil layer still contributes. Further work indicates a high-permeability connection in the lower interval. Selective isolation and injector conformance changes may then be evaluated together. This is a hypothetical example, but it illustrates why diagnosis should precede action.
✅ The Core Principle: Diagnose Before You Control
Increasing water production can result from normal reservoir depletion, aquifer advance, coning, injection breakthrough, heterogeneity, unwanted zonal communication, or mechanical failure. Those mechanisms can look similar at surface while requiring opposite responses underground.
The durable approach is to verify measurements, locate inflow, understand the reservoir-scale flow path, assess well integrity, and compare interventions against both oil recovery and water-management consequences. Water is not simply a waste stream; it is information about how the reservoir and well are behaving.
The best water-management decision is rarely the fastest treatment—it is the intervention matched to a demonstrated source, mechanism, and field-level objective. 💧🛢️📈