
An oil well may appear to have a simple problem: production is lower than expected. The first instinct is often to blame the reservoir, a damaged completion, scale in the tubing, an undersized choke, or backpressure from the separator. Any one of these may be responsible—but changing equipment before locating the restriction can waste time and create a new operating problem.
Consider a flowing well whose rate has gradually declined. Its reservoir pressure still supports production, yet the well is producing far below its apparent potential. The production team must decide whether to stimulate the formation, clean out the wellbore, install artificial lift, change tubing, or adjust surface conditions.
Nodal analysis brings these decisions into one engineering framework. It represents the complete pressure-loss path from the reservoir to the surface system and shows where the available pressure is being consumed.
For students, it is a practical way to connect reservoir engineering, production technology, fluid behavior, and surface operations. For working professionals, it is a disciplined method for identifying the bottleneck that most limits well performance. 📈
🧭 1. What Nodal Analysis Does
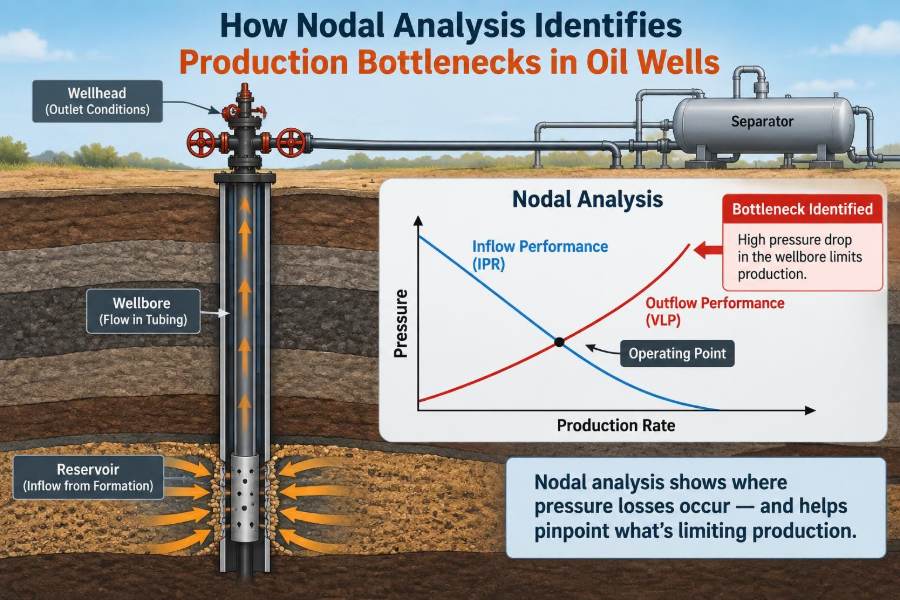
Nodal analysis is a pressure-system method used to predict and diagnose well performance. The well is divided at a selected point, called a node, into an inflow side and an outflow side.
The inflow side describes the pressure needed to deliver fluids from the reservoir to the node. The outflow side describes the pressure needed to move those fluids from the node through the wellbore and surface equipment to the final backpressure.
At a feasible operating condition, both sides predict the same pressure at the same flow rate. Their intersection identifies the rate and pressure at which the system can operate.
🎯 2. Why Production Bottlenecks Matter
A bottleneck is the part of the production system that imposes the most significant constraint on flow under the conditions being studied. It may be below the perforations, near the sandface, in tubing, across a choke, or downstream in the gathering system.
Not every pressure drop is a bottleneck. Some pressure loss is unavoidable, and reducing a small loss may have little effect on total rate. Nodal analysis helps distinguish a meaningful constraint from a visible but less important one.
- It supports better candidate selection for interventions.
- It compares alternatives before field expenditure.
- It reveals when a surface change cannot overcome a reservoir limitation.
🛢️ 3. The Complete Production System
A producing well is not a collection of independent components. It is a connected system in which a change in one location alters pressures, rates, gas liberation, and pressure losses elsewhere.
The system commonly includes the reservoir, near-wellbore region, perforations, completion, tubing, artificial-lift equipment if present, wellhead, choke, flowline, separator, and downstream pressure constraints.
Nodal analysis keeps this whole path in view. This is important because a lower wellhead pressure, for example, can increase drawdown, change multiphase flow behavior, and alter the operating point rather than merely “pulling” more liquid from the well.
📍 4. Choosing the Node
A node can be placed wherever an engineer needs to evaluate performance. Common choices are the sandface, perforations, tubing intake, pump intake, wellhead, choke, or separator inlet.
The best node depends on the question. A node at the tubing intake is useful for evaluating tubing and lift performance, while a node at the sandface is useful for examining reservoir inflow and near-wellbore effects.
The mathematics remains consistent: calculate pressure approaching the node from upstream and pressure required to leave the node downstream. A well-designed analysis clearly states the node and the pressures used.
🌊 5. Inflow Performance Relationship
The inflow performance relationship, usually called IPR, describes the relationship between flow rate and flowing pressure at the reservoir-facing side of the node. For a naturally flowing oil well, it is often expressed in terms of bottomhole flowing pressure and liquid rate.
As flowing pressure decreases, drawdown between average reservoir pressure and flowing pressure increases. This generally raises the rate, but the response depends on reservoir properties, fluid properties, completion efficiency, and flow regime.
An IPR may be based on a productivity index for suitable conditions or on a nonlinear relationship when solution-gas drive and multiphase flow are important. The selected model must match the available data and expected behavior.
🧱 6. Reservoir Deliverability and Productivity Index
Under simplified single-phase conditions, productivity index relates production rate to drawdown. A higher productivity index means the reservoir-completion system can deliver more fluid for a given pressure reduction.
Real wells often depart from this simple behavior. Gas evolving near the wellbore, changing relative permeability, non-Darcy effects, water production, and pressure depletion can all alter inflow performance.
For that reason, productivity index is useful but should not be treated as a permanent well property. It reflects the conditions, data quality, and model assumptions used to estimate it.
🩹 7. Skin: A Near-Wellbore Bottleneck
Skin represents an additional pressure drop near the wellbore relative to an ideal reference condition. Positive skin can result from formation damage, fines migration, scale, poor cleanup, limited perforation effectiveness, or other restrictions to flow.
Negative skin may result from stimulation that improves flow communication with the reservoir. In nodal analysis, a positive skin shifts the inflow curve so that more drawdown is needed to achieve the same rate.
A large positive skin is often an attractive intervention target, but it must be diagnosed carefully. Apparent skin can sometimes reflect uncertain pressure data, changing saturation effects, or an incomplete inflow model.
🕳️ 8. Perforations and Completion Restrictions
Fluid does not move directly from the reservoir into an open pipe. It passes through perforation tunnels, completion hardware, and often zones with altered permeability near the wellbore.
Perforation density, phasing, penetration, crushed-zone damage, partial penetration, and interval coverage can affect pressure loss and inflow distribution. In layered reservoirs, some intervals may contribute much more than others.
Nodal analysis can include a completion pressure-loss component when it is relevant. This prevents engineers from incorrectly assigning all lost pressure to the reservoir or the tubing.
⬆️ 9. Vertical Lift Performance
The vertical lift performance, or VLP, describes the pressure required to lift fluids from a selected downhole point to the surface at a given rate. It is the core outflow relationship for a flowing well.
VLP depends on tubing depth and diameter, fluid composition, pressure and temperature behavior, water cut, gas-liquid ratio, flow regime, well deviation, roughness, and surface boundary pressure.
Unlike a simple liquid line, a producing well often contains multiphase flow. The gas fraction can expand substantially as pressure falls, making pressure-gradient behavior nonlinear and sometimes counterintuitive.
💨 10. Multiphase Flow Changes the Picture
Pressure loss in a multiphase well includes hydrostatic, frictional, and acceleration components. Their relative importance changes with rate, gas fraction, tubing geometry, and flow regime.
At low rates, liquid holdup and hydrostatic head may dominate. At higher rates, friction can become increasingly important. Gas can reduce mixture density and assist lifting, yet excessive or poorly managed free gas can also impair some artificial-lift systems.
Because of these interactions, a simple assumption that larger tubing always improves production is not reliable. A VLP calculation or validated correlation is needed to test the expected result.
📉 11. Reading the Operating Point
On a conventional nodal plot, the inflow curve and outflow curve are plotted using a common rate axis and the pressure at the chosen node. The intersection is the predicted operating point.
At rates below the intersection, the system pressure relationships favor an increase in rate. At rates above it, the available inflow pressure is insufficient to meet the pressure required by the outflow path.
The operating point is not a fixed property of the well. A change in reservoir pressure, water cut, choke setting, tubing condition, gas composition, or separator pressure can move it.
🔎 12. What a Bottleneck Looks Like on Curves
A bottleneck is identified by testing how changes to a system component shift the inflow or outflow relationship and, in turn, move the operating point. The most useful opportunity is usually the change that produces a meaningful, technically credible rate improvement.
If reducing separator pressure strongly shifts the outflow curve and increases the predicted rate, surface backpressure may be limiting. If reducing skin shifts the inflow curve much more than any surface change, the near-wellbore region may be the priority.
The conclusion should be comparative, not merely visual. Engineers should ask: which feasible change creates the greatest benefit within operational and economic limits?
🧪 13. Reservoir-Limited Wells
A reservoir-limited well has insufficient inflow capacity to sustain a much higher rate, even if downstream restrictions are reduced. Common indicators include a low predicted inflow response to lower flowing pressure and a curve intersection controlled mainly by the IPR.
For these wells, opening the choke or lowering separator pressure may offer limited gain. Potential remedies may instead involve stimulation, additional reservoir contact, recompletion, conformance work, or a different development strategy.
Artificial lift can lower flowing pressure in many cases, but it cannot create reservoir deliverability where fluid mobility or pressure support is fundamentally inadequate.
🚧 14. Wellbore-Limited Wells
A wellbore-limited well loses excessive pressure between the downhole node and the wellhead. Causes can include restrictive tubing, scale or wax deposition, liquid loading, unfavorable deviations, damaged equipment, and unsuitable flow conditions.
In nodal terms, the VLP requirement is too high for the desired rate. Interventions may include cleanout, chemical treatment, tubing redesign, changes in operating conditions, or artificial lift optimization.
A careful diagnosis separates a true tubing restriction from changing fluid properties. For example, rising water cut can alter hydrostatic pressure even when the tubing itself is clean.
🎛️ 15. Choke and Wellhead Restrictions
The choke creates a deliberate pressure drop to control rate, protect facilities, manage drawdown, and maintain stable operation. It can also become a production constraint when its size or operating policy creates excessive upstream pressure.
Choke performance should be evaluated alongside sand production risk, water or gas handling limits, erosion, hydrates, flow assurance, and reservoir-management objectives. Maximum immediate rate is not always the correct operating target.
A nodal model can estimate the response to different choke conditions, but field changes should be made within approved operating envelopes and monitored for stability.
🏭 16. Flowline and Separator Backpressure
Pressure losses do not end at the wellhead. A restrictive flowline, rising manifold pressure, separator pressure, or downstream compression limitation can increase backpressure and reduce the well’s drawdown.
These constraints are especially important in integrated systems where several wells share gathering infrastructure. Improving one well’s surface path may affect pressures and rates in neighboring wells.
Nodal analysis can use a specified downstream pressure or incorporate more detailed surface-network results. The key is to use a boundary condition that represents the actual operating system.
⚖️ 17. Comparing Common Bottlenecks
The location of a restriction influences the curve that changes and the intervention options that deserve attention. The comparison below is conceptual; the actual response must be calculated using well-specific data.
| Constraint location | Main nodal effect | Typical questions |
|---|---|---|
| Reservoir or skin | Changes inflow capacity | Is drawdown effective? Is stimulation justified? |
| Perforations or completion | Adds local pressure loss | Are intervals accessible and contributing? |
| Tubing and wellbore | Raises VLP requirement | Is lift, cleanup, or tubing redesign needed? |
| Choke and surface network | Raises downstream backpressure | Can surface pressure be reduced safely? |
More than one bottleneck may exist. Removing the first limiting restriction can expose the next one, so nodal analysis should be repeated after a major change.
🛠️ 18. Natural Flowing Wells
For a naturally flowing well, nodal analysis asks whether reservoir energy can overcome all pressure losses to deliver fluid to the required surface pressure. The intersection of IPR and VLP gives the predicted natural-flow rate.
If no intersection exists at a positive, practical rate, the well may not flow naturally under the assumed conditions. Lowering backpressure, reducing wellbore losses, or adding artificial lift may create a viable operating point.
This does not mean every non-flowing well needs the same lift method. The nodal result identifies a pressure deficit; equipment selection requires additional operational and economic analysis.
⚙️ 19. Artificial Lift in the Nodal Framework
Artificial lift modifies the outflow side of the system by supplying energy, reducing fluid density effects, lowering intake pressure, or otherwise changing the pressure path. The goal is to move the operating point to a more productive and sustainable condition.
For example, a pump can reduce pressure at its intake, while gas lift can alter the pressure gradient above the injection point. The resulting VLP curve must be matched with the well’s inflow ability.
Lift design is therefore not just an equipment-sizing exercise. A powerful system can be underutilized in a low-productivity well, while an undersized system may leave valuable drawdown unused.
🔄 20. Sensitivity Analysis Finds the Best Lever
A single base-case nodal plot is only the start. Sensitivity analysis changes one or more uncertain inputs to show which variables have the greatest influence on predicted rate and pressure.
Useful sensitivities often include skin, reservoir pressure, tubing size, water cut, gas-liquid ratio, wellhead pressure, separator pressure, choke setting, pump depth, lift-gas rate, and fluid-property assumptions.
Testing alternatives one at a time clarifies cause and effect. Testing realistic combinations can reveal whether an intervention works only when paired with a surface change or a different lift design.
📏 21. Data Needed for a Credible Model
Nodal analysis is only as reliable as its inputs. The required data vary with the selected node and model complexity, but pressure measurements and a clear description of the flow path are essential.
- Reservoir pressure, inflow-test information, and completion details.
- Producing rate, water cut, gas production, and representative fluid properties.
- Tubing, casing, depth, deviation, and restriction dimensions.
- Wellhead, choke, flowline, and separator pressures.
- Temperature information and artificial-lift operating data when applicable.
Data should be recorded with units, measurement conditions, and dates. Mixing stabilized and transient observations without recognizing the difference can produce misleading calibration.
✅ 22. Calibrating Against Field Measurements
A model should be checked against observed rates and pressures before it is used to recommend a major change. Calibration may involve matching flowing tubing pressure, wellhead pressure, bottomhole pressure when available, and measured production conditions.
Agreement at one point does not prove that every prediction is correct. It does, however, expose major inconsistencies in fluid properties, pressure boundaries, geometry, or assumed pressure-loss behavior.
When the model does not match the field, the solution is not automatically to force a tuning factor. First investigate data quality, flow stability, measurement location, changing conditions, and missing restrictions.
⚠️ 23. Common Modeling Mistakes
Many poor nodal conclusions arise from reasonable-looking models built on inconsistent assumptions. A visually polished curve does not compensate for uncertain inputs or an inappropriate flow model.
- Using an outdated reservoir pressure without a depletion check.
- Applying a fluid sample that is not representative of current production.
- Ignoring water production, free gas, scale, or tubing changes.
- Assuming a fixed separator pressure when the network is variable.
- Comparing scenarios with different boundary conditions unintentionally.
- Treating a transient test point as a stabilized operating point.
Documenting assumptions makes these risks easier to identify during technical review.
🧩 24. A Practical Diagnostic Workflow
A structured workflow avoids jumping from a low rate directly to a favorite intervention. Start by defining the decision: increase rate, restore production, reduce instability, select lift, or evaluate a workover.
- Verify current production rates, pressures, fluid data, and mechanical configuration.
- Select a node aligned with the decision.
- Build and calibrate the base-case inflow and outflow relationships.
- Identify the present operating point and pressure-loss distribution.
- Run sensitivities for credible reservoir, wellbore, and surface changes.
- Rank options by technical effect, feasibility, risk, and economics.
- Implement, monitor, and update the model with new field data.
This cycle turns nodal analysis into an operating tool rather than a one-time plotting exercise.
🧠 25. Interpreting Results Without Overconfidence
Nodal analysis is a model of a real system, not the system itself. It simplifies complex reservoir flow, multiphase behavior, equipment performance, and surface interactions into relationships that can be evaluated consistently.
Results are strongest when they are supported by pressure surveys, production tests, fluid characterization, completion records, and operational experience. They are weaker when key inputs are inferred from sparse or nonrepresentative data.
A good engineer communicates both the recommended action and the uncertainty around it. This is particularly important when small predicted rate differences are within the likely range of input uncertainty.
🤝 26. Connecting Disciplines Through One Model
Nodal analysis is valuable because it creates a common technical language. Reservoir engineers can evaluate deliverability, production engineers can assess lift and tubing performance, and facilities engineers can examine backpressure in the same pressure-rate framework.
The method also improves conversations with operations teams. Instead of saying that a well “needs a bigger choke” or “needs stimulation,” the team can identify the expected pressure change, the assumed constraints, and the measurements needed to confirm the result.
That shared view helps prevent isolated optimizations that simply transfer a limitation from one part of the production system to another.
🏁 27. The Core Principle: Match Inflow to Outflow
The central principle of nodal analysis is straightforward: a well produces where its reservoir and completion can supply fluid at the same rate that the wellbore and surface system can transport it. The intersection of inflow and outflow relationships defines that balance.
Production bottlenecks become visible when engineers test how the balance changes after reducing skin, altering tubing losses, optimizing lift, changing choke conditions, or lowering downstream backpressure. The best action is the one that improves the whole system—not simply one component.
Nodal analysis identifies production bottlenecks by showing exactly where pressure is lost, how that loss limits the operating point, and which realistic change can move the well toward better performance. 🛢️📈🔧